TIBCO BusinessEvents® Extreme Administrator provides a graphical user interface (GUI) for managing TIBCO BusinessEvents® Extreme domains and nodes. It automatically discovers all nodes on the network and presents them to you as a visual collection. You can log on to nodes or domains, and then "drill down" to monitor and control managed elements within them.
The TIBCO BusinessEvents® Extreme Administrator login screen is shown in Figure 1.1, “Domain login dialog”.
Upon a successful login into the domain, you are automatically logged into all currently active managed nodes in the domain.
See Chapter 5, Security for details on defining principals and their credentials that can manage a domain.
After you start and log in to TIBCO BusinessEvents® Extreme
Administrator,
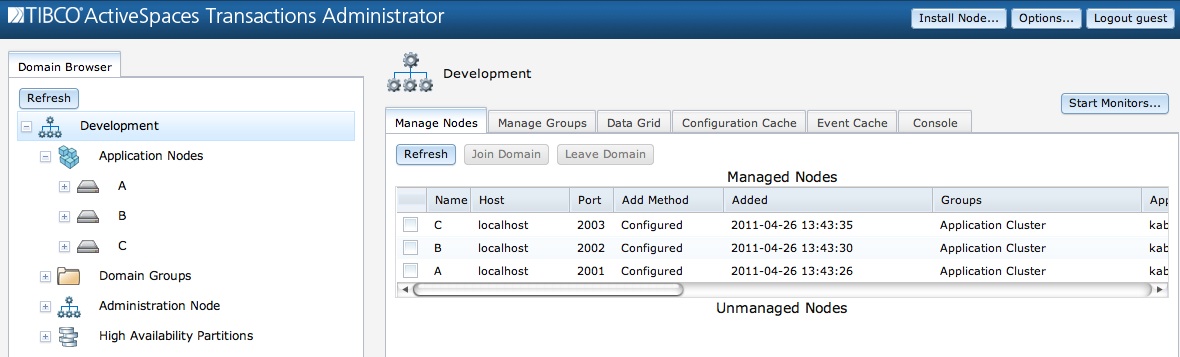
you see an overview screen that displays the Domain
Browser in the left-hand pane and the Manage
Nodes display in the right-hand pane, as shown in Figure 1.2, “TIBCO BusinessEvents® Extreme
Administrator”. The left-hand pane contains these
areas:
Domain - the top level container for everything in the Domain Browser. This is the domain that was logged into.
Application Nodes - a container for all application nodes being managed by the domain.
![[Note]](images/note.png)
Only managed nodes show up in the
Application Nodescontainer.Domain Groups - a container for all defined domain groups.
Administration Node - a container for the node hosting the Domain Manager.
High Availability Partitions - a container for all partitions defined in the cluster.
| |
You can use the refresh button in the Domain Browser to update the displayed information. |
When you select an application node, information about the node is displayed in the right-hand pane, as shown in Figure 1.3, “Application node display”.
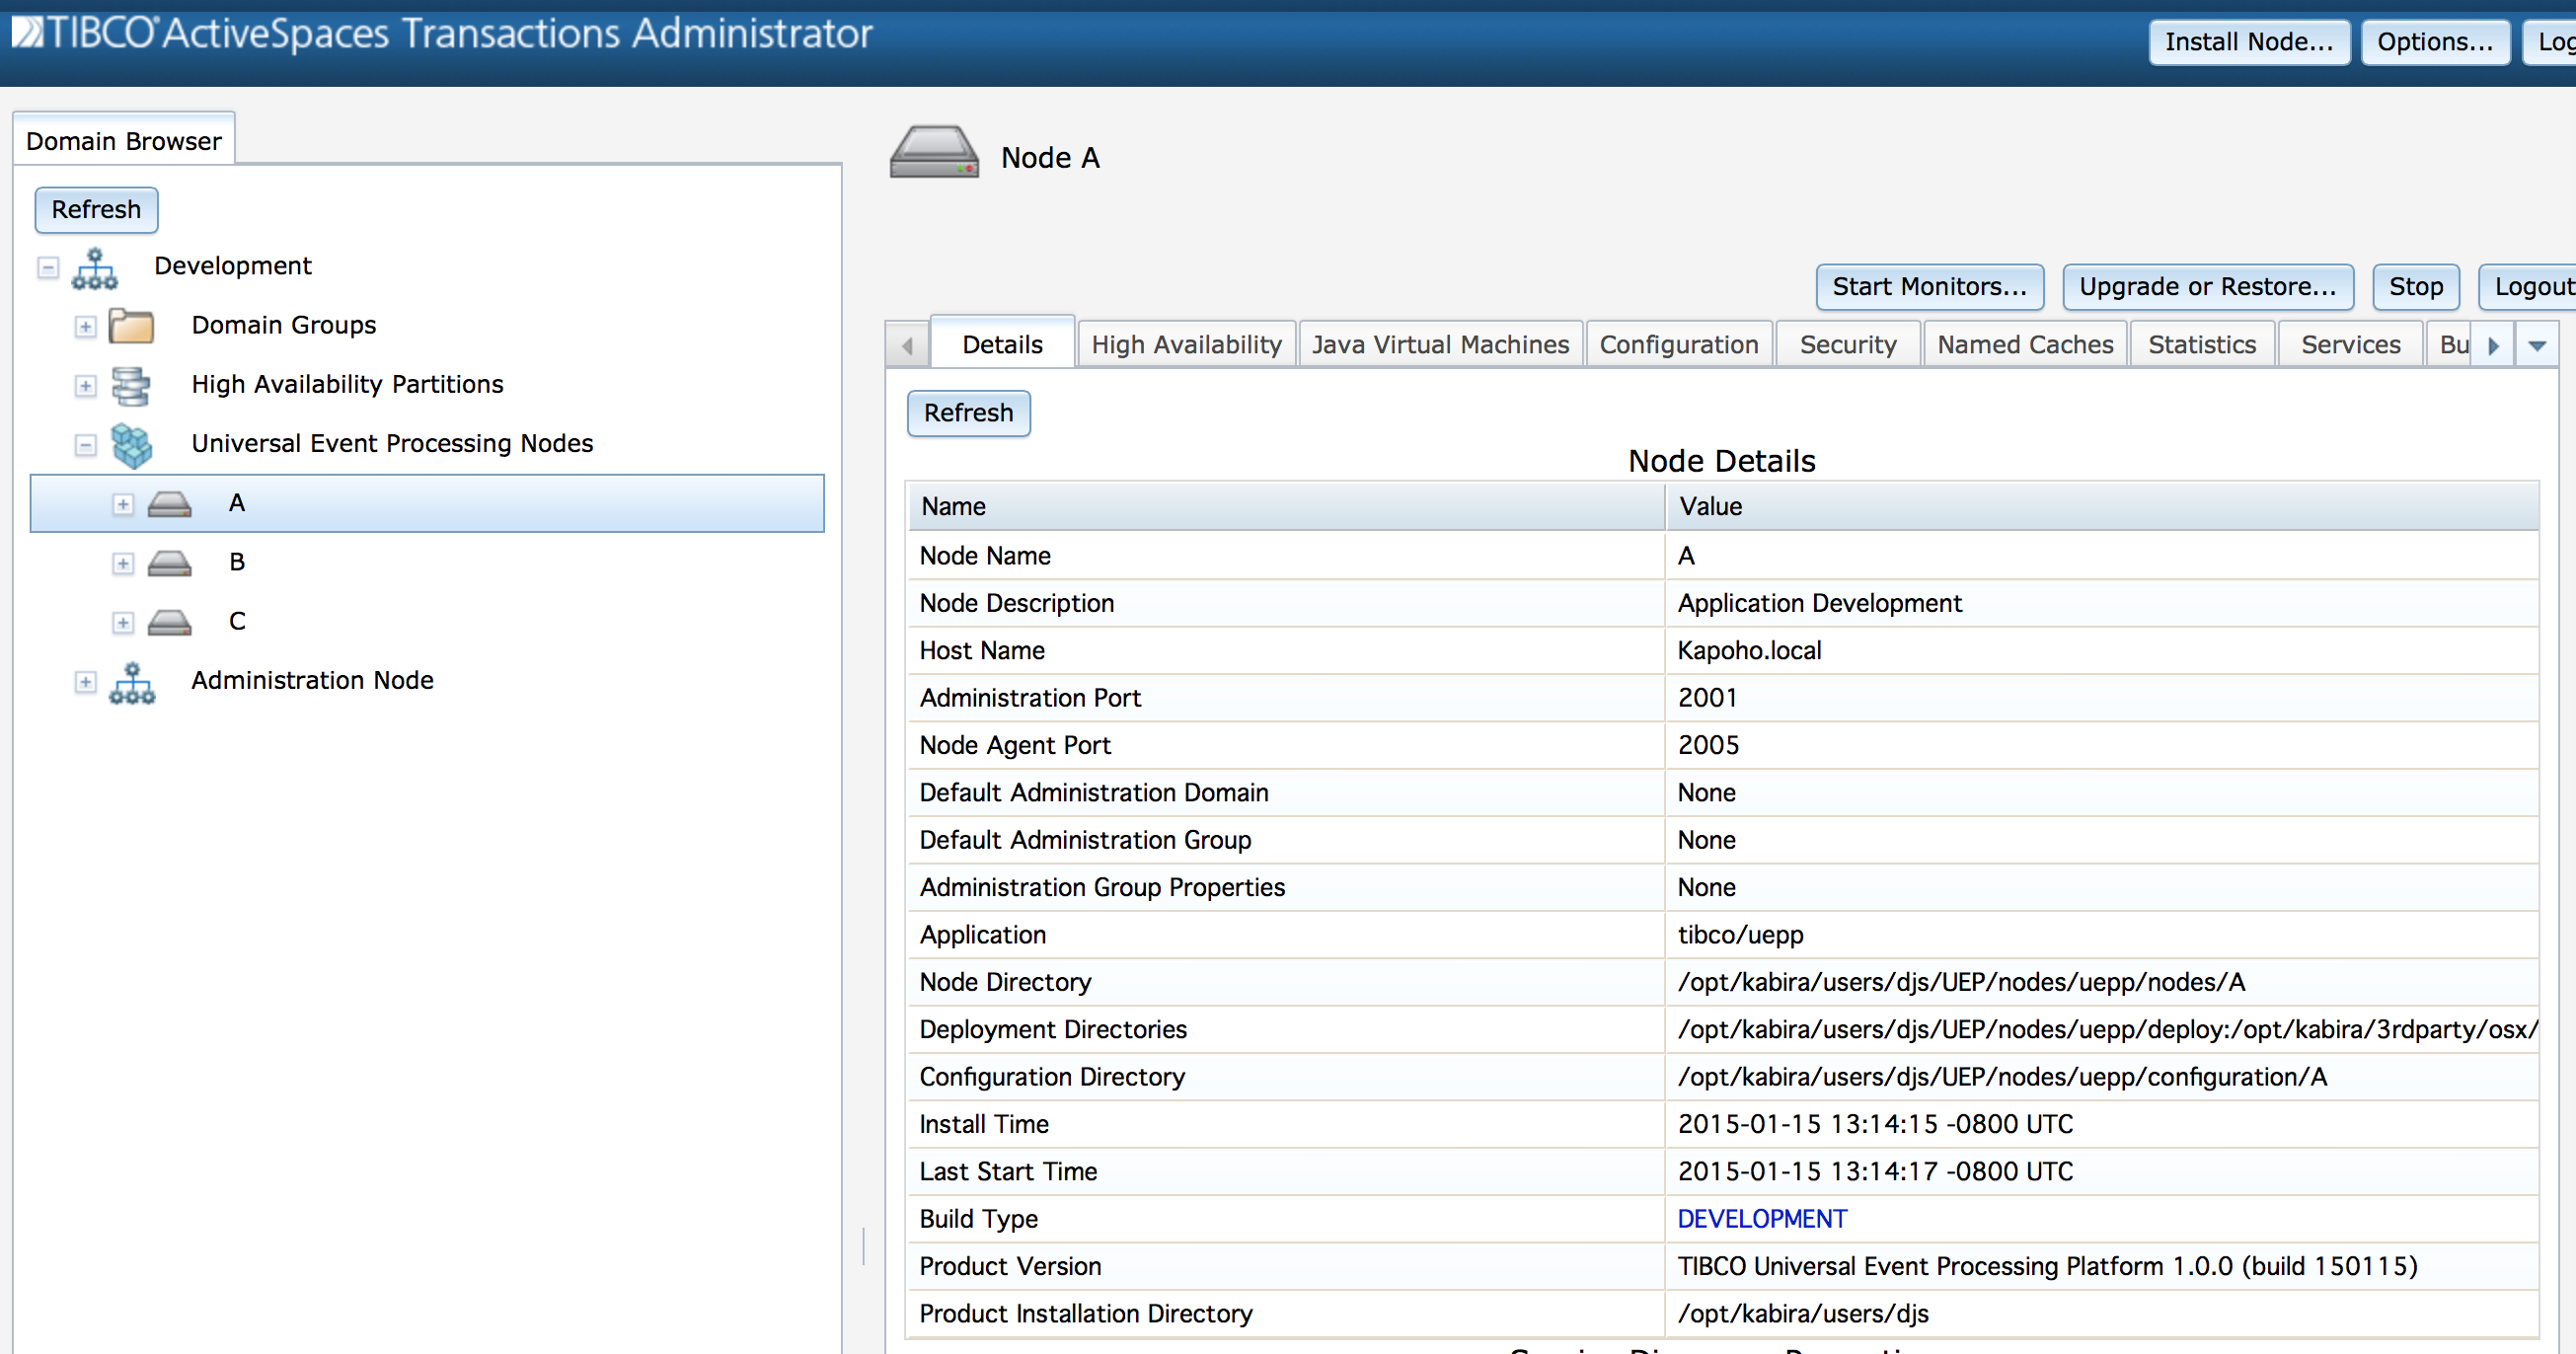
Recall the managed element hierarchy shown in TIBCO BusinessEvents® Extreme Architect's Guide -- you can see that most elements are contained within a node. To access these elements in TIBCO BusinessEvents® Extreme Administrator, you must be logged into the node (usually this happens automatically when you log into a domain). When you are logged into a node a set of tabs tabs appear as shown in Figure 1.3, “Application node display”. These tabs provide detailed displays and control of the individual managed elements. The tabs for a node are:
Details - generic node details
High Availability - high availability status, including quorum status, discovered nodes, and known partitions.
Java Virtual Machines - display and managed JVMs running on the node.
Configuration - display and control node configuration data.
Security - display security information in affect on the node.
Statistics - display node runtime statistics.
Services - control services, endpoints, and session.
Business State Machines - control and monitor business state machines.
Console - console access for the node.
When you log into TIBCO BusinessEvents® Extreme Administrator, you are automatically logged into the Domain Manager node that is hosting the TIBCO BusinessEvents® Extreme Administrator Web Server.
As shown in Figure 1.2, “TIBCO BusinessEvents® Extreme Administrator”, these tabs are available when the domain is selected to manage the domain:
Manage Nodes - add and remove nodes from the domain.
Manage Groups - add domain groups.
Configuration Cache - manage the domain configuration cache.
Log Messages - display log messages from managed nodes.
Console - console access to the domain.
Nodes generate log messages for normal and exceptional conditions. These log messages are available in:
Node log files.
Domain Manager log message cache.
Domain Manager event monitor.
No matter where log messages are viewed, they have the same content:
Time Stamp - time log message was generated.
Priority - message priority.
Identifier - message identifier.
Originator - message originator identifier.
Transaction - transaction identifier for transaction in which message was logged.
Message - a textual message.
In addition, log messages displayed from the Domain Manager log message cache or monitor also contain the node name that generated the log message. Here is an example log message displayed in the Domain Manager event monitor:
Node Name = A
Date Time = 2008-09-10 12:57:38
Event Topic = kabira.kts.security
Event Identifier = switchadmin::EventIdentifiers::OperatorActionSucceeded
Event Originator = switchadmin::PluginServiceImpl:1 (344579:8358104:7100:1 offset 67017096)
Message = Administrator command [display] on target [security] executed by principal [guest] succeeded.
The Domain Manager log message cache provides a historical cache of all messages raised by nodes being managed by a domain manager. The log message cache supports the following filters:
Node Name - only show messages for a specific node.
Topic - only show messages for a specific topic.
Identifier - only show messages with a specific messages identifier.
Originator - only show messages from a specific originator.
Contains - only show messages that contain a specific phrase.
Start Time - only show messages after a specific start time.
End Time - only show messages before a specific end time. If not specified all messages from start time are displayed.
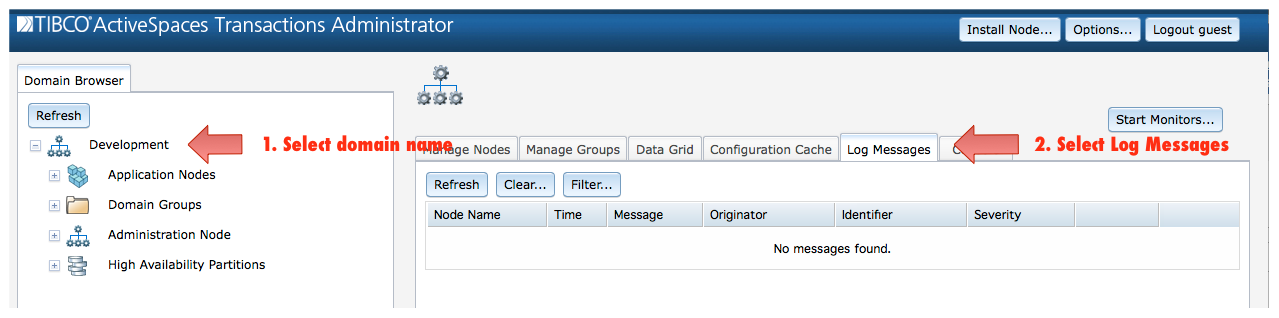
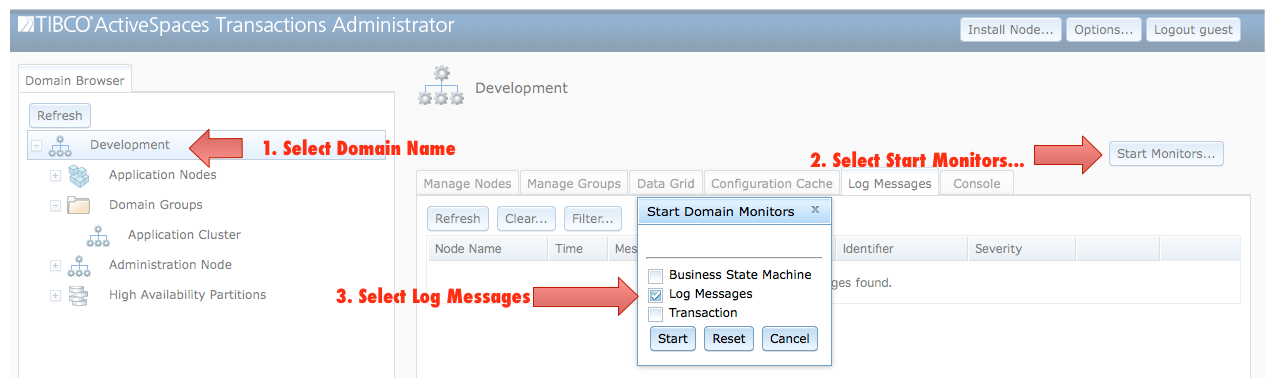
Figure 1.4, “Accessing the log message cache” shows how to access the log message cache.
The log message monitor is available on the domain. It provides asynchronous notification of log messages reported by all nodes being managed by the domain. Figure 1.5, “Log message monitor” shows the running message monitor.
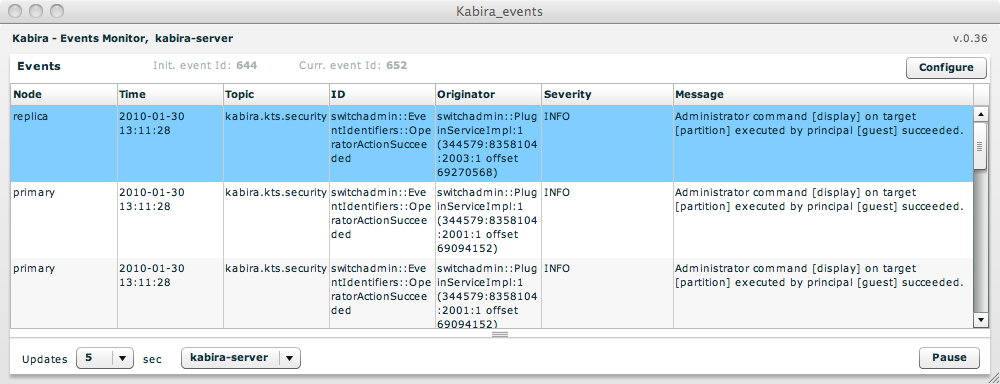
Figure 1.6, “Accessing the log messages monitor” shows how to access the log messages monitor.
TIBCO BusinessEvents® Extreme Administrator provides the following monitors:
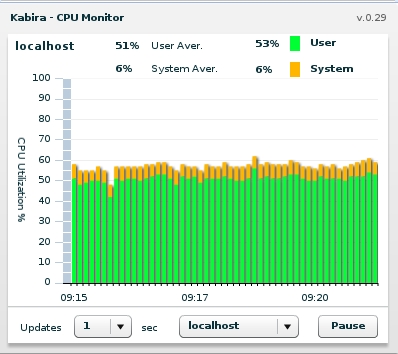
CPU utilization monitor
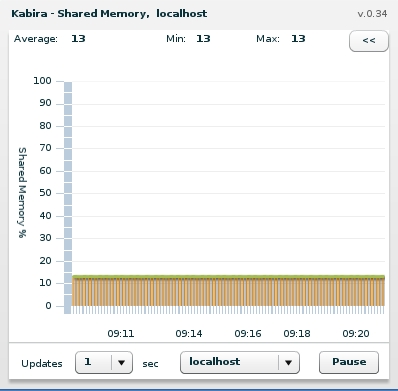
Shared memory monitor
Transaction monitor
The CPU and shared memory monitors are available on any running node - this includes application and Domain Manager nodes. Figure 1.7, “CPU monitor” shows the CPU monitor and Figure 1.8, “Shared memory monitor” shows the shared memory monitor.
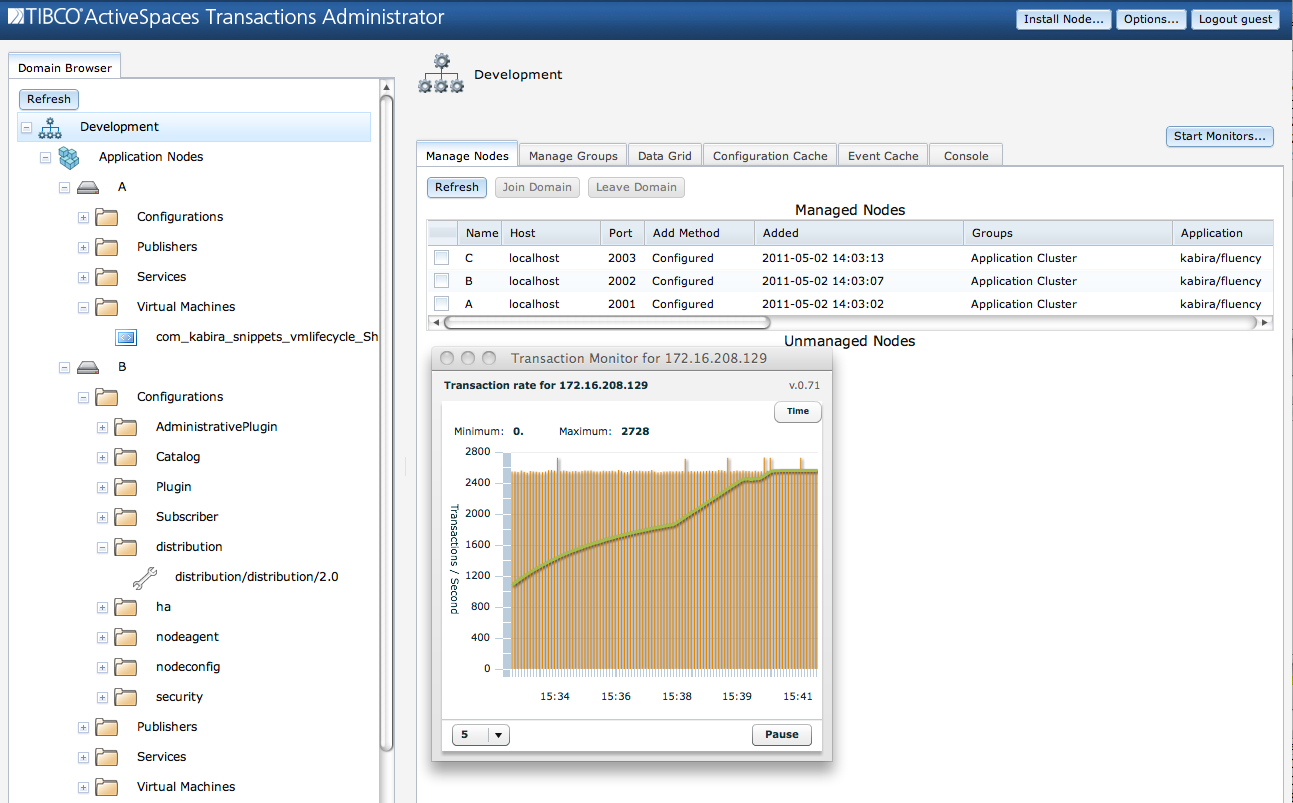
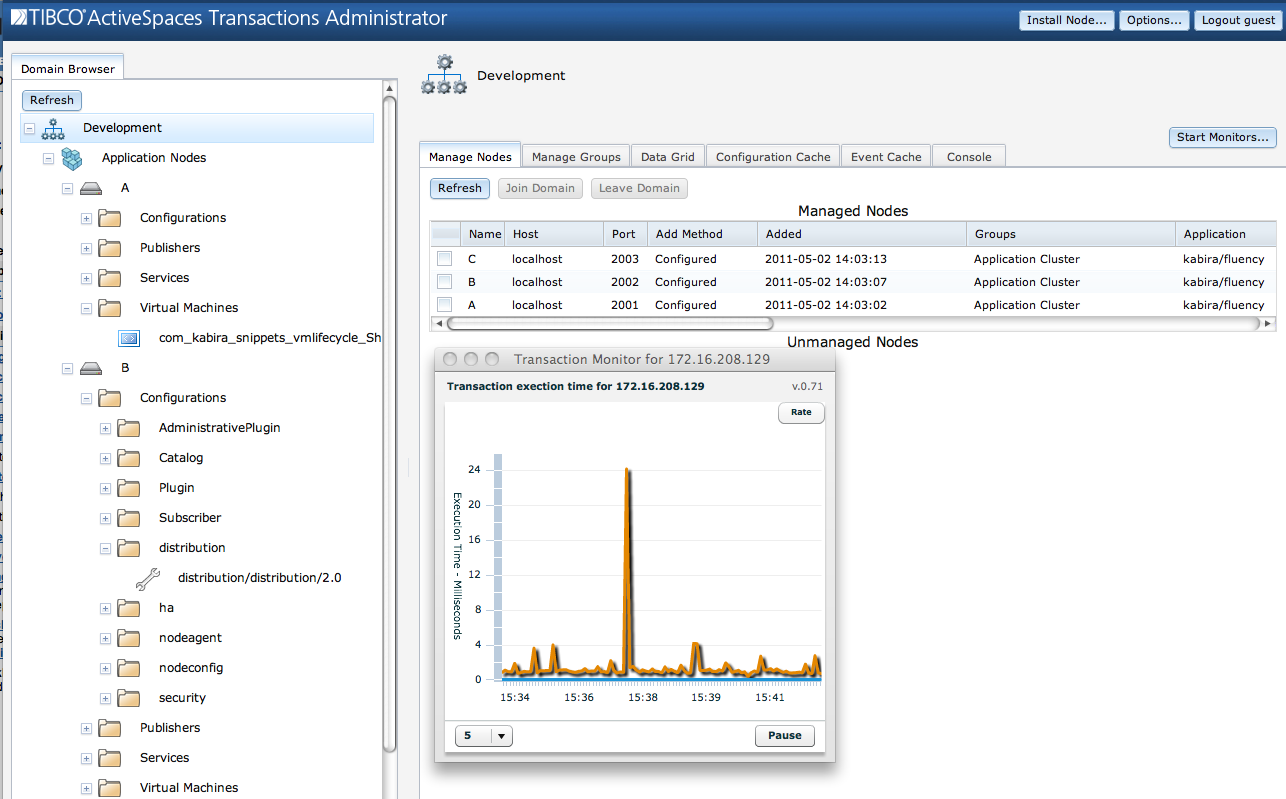
The transaction monitor is available per node and on the domain. Starting the transaction monitor on the domain displays an aggregate transaction rate for all nodes being managed by the domain. Two different displays are available from the transaction monitor:
total and average number of transactions (see Figure 1.9, “Transaction count”).
minimum, average, and maximum transaction latency (see Figure 1.10, “Transaction latency”).
TIBCO BusinessEvents® Extreme
Administrator provides a way to perform most
management tasks. However, sometimes solution specific administrative
commands may be introduced that are not integrated with TIBCO BusinessEvents® Extreme
Administrator. The console tab provides a way to issue arbitrary
administrator commands from within TIBCO BusinessEvents® Extreme
Administrator. Every management function is available from the command
line, so the Console tab provides a way to access any
features that TIBCO BusinessEvents® Extreme
Administrator does not already address.
Click on the Console tab as shown in Figure 1.11, “Console”.
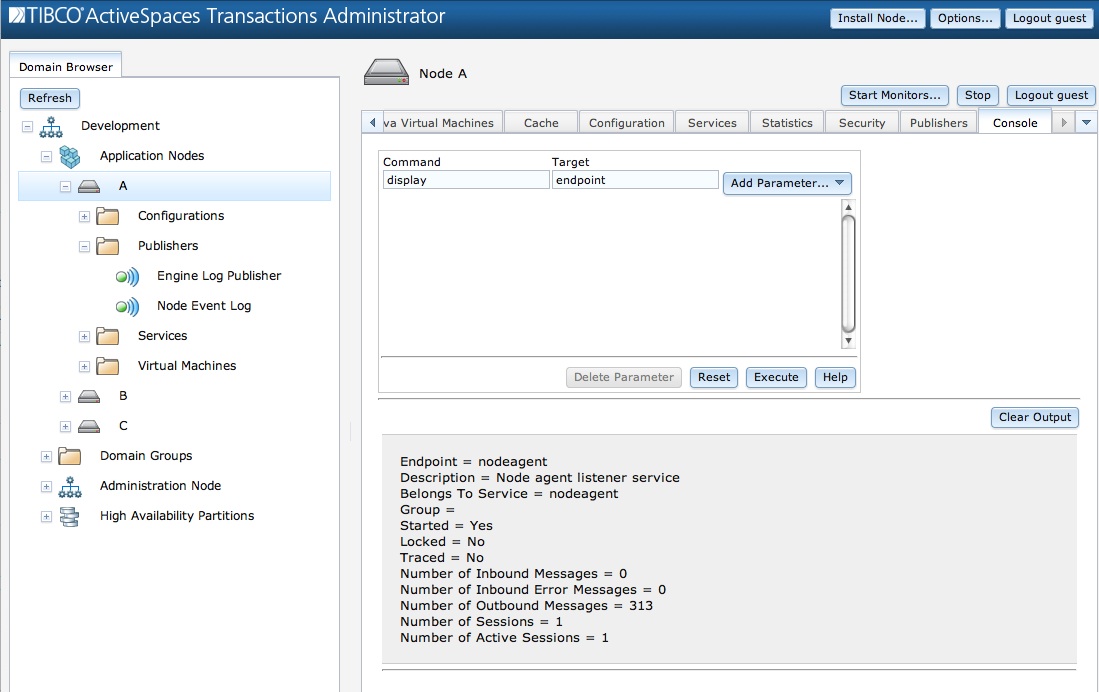
The fields under the Console tab correspond to
the elements of the administrator command line
interface. the section called “Command line interface”
explains this interface and what these fields mean.