About the add-on
Data profiling overview
The TIBCO EBX® Insight Add-on (New) allows you to profile your data. Profiling can help you to determine whether data is fit for consumption by other business units or systems in your organization. Profiling involves measuring, monitoring, and reporting on specific characteristics, or dimensions, that indicate overall data quality.
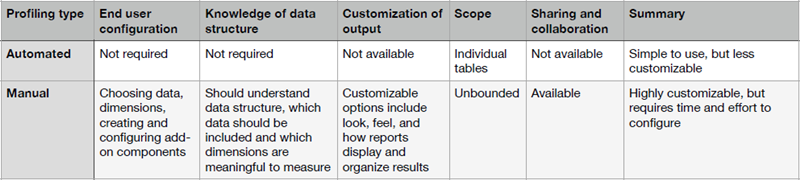
The add-on allows you to use two methods to profile data: Automated profiling and Manually configured profiling. The following table highlights features, benefits, and drawbacks of each type:
Add-on reporting components
The main components the add-on uses to communicate profiling results are dashboards, sections, and indicators. Dashboards and the sections within them categorize and organize indicators. Each indicator presents visual feedback on a specific data dimension. As highlighted in the following sections, the dashboards for manual and automatic profiling differ slightly.
Automatic profiling
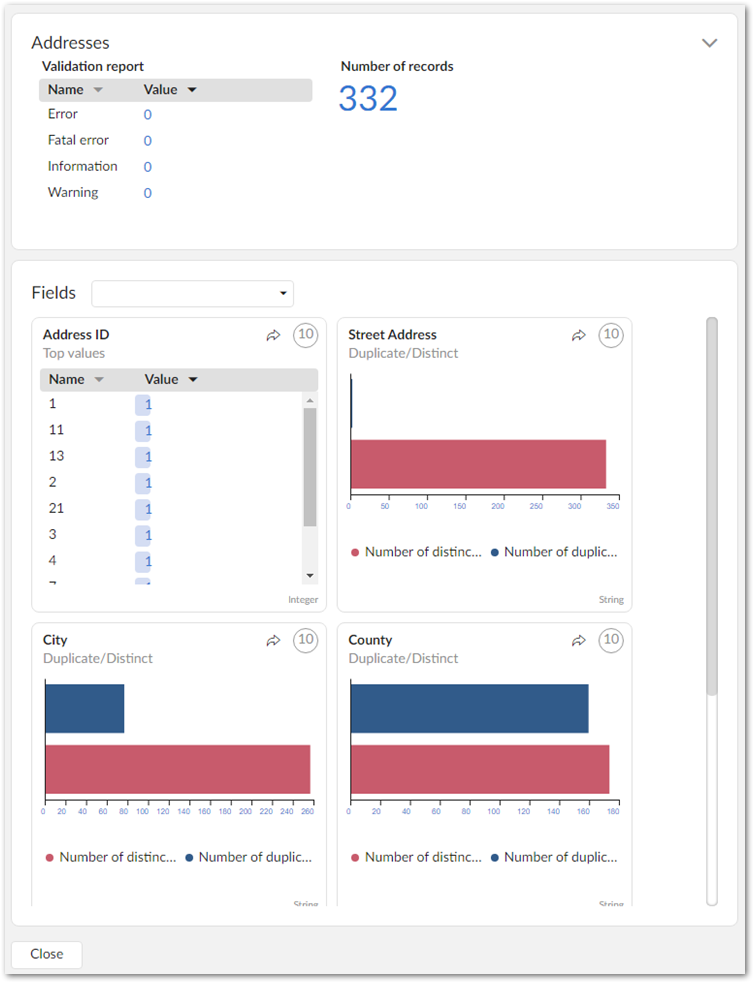
When enabled by an administrator for your user profile, you can run the Launch data profiling service to automatically generate a report on table data. The report includes a dashboard with sections and indicators that correspond to the table and its fields. The indicators that display in the Fields section are determined by the data type of each field. You can drill down on the field indicators to see additional indicators for each field. Again, the available indicators are based on the field data types.
The following image shows an dashboard generated after automatically profiling a table:
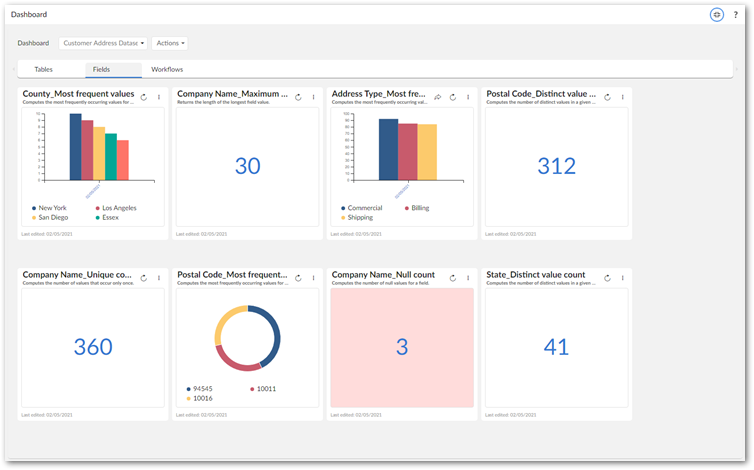
Manually configured profiling
After creating dashboards and sections to organize results, you configure an indicator by pointing it to a TIBCO EBX® asset, such as a table or field. You specify how the asset is profiled by choosing a function that measures one of the asset's dimensions. Measurable dimensions, include completeness, accuracy, and precision. Some of the built-in functions to measure these dimensions compute the number of missing or null values in a table, or the average length of values in a given field.
Before configuring indicators, you might want to take the time to understand which dimensions are valuable for a particular dataset and how they should be measured. For example, to ensure marketing resources are properly allocated, you might configure an indicator to ensure a certain number of a customer table's email address field are not null.
The following dashboard shows a manually configured dashboard: