Spotfire® Enterprise Runtime for R

Aggregating Binned Weather Data Using TERR in Spotfire

Using a TERR expression function to aggregate data, you can create a Spotfire visualization that provides greater insight. This simple, generic example adds a custom expression, demonstrating how you might use these functions, and others like them, in your own analyses.

About this task

Perform this task in Spotfire. This task uses the data set air, which you can find in air data set for Spotfire examples.
Note: This data set is a data frame with observations (rows) on four variables (columns), taken from an environmental study that measured ozone, solar radiation, temperature, and wind speed for 5 months in 1973 in the New York City area.

Before you begin

In Spotfire, load the air data. You can copy the table from the air data set example.
Tip: You can copy (CTRL+C) the contents of the sample data table and paste it (CTRL+V) into the Spotfire user interface.

Procedure

  1. Create a scatter plot, and set the axes as follows.
    • Set the X-axis to ozone.
    • Set the Y-axis to wind.
  2. Click the Color by drop-down list, and in the resulting dialog box, select temperature, and select the Auto-bin column check box.
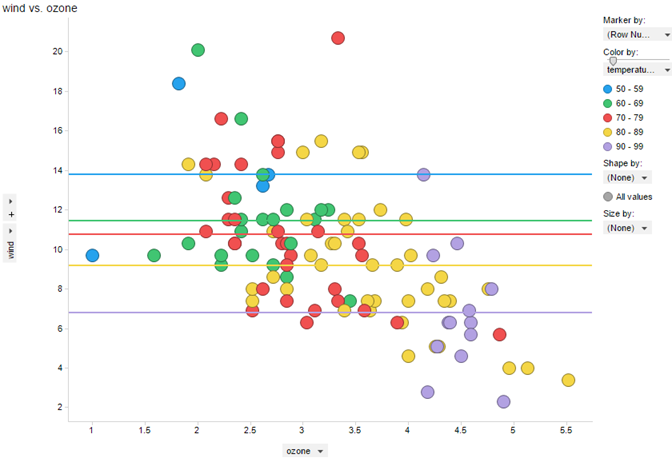
    By default, the expression results in the expression AutoBinNumeric([temperature],5), which provides for 5 bins. You can change this value, but for the example, leave it a 5.
    The scatter plot points are colored by temperature, binned into five ranges, appearing as follows.

    example showing binned color ranges

  3. Right-click the visualization, and from the menu, click Properties.
  4. In the Properties dialog box, select Lines & Curves.
    The Lines & Curves properties are displayed.
  5. Click Add > Horizontal Line > Straight Line.
    The Horizontal Line dialog box is displayed.
  6. Click Custom expression, and then click Edit.
    Note: This location is just one of many ways you can access and create a custom expression in Spotfire.
  7. In the Custom Expression dialog box, in the Category drop-down text box, select Statistical functions.
  8. Scroll down the function list, and then from the list, double-click TERRAggregation_Real.
    TERRAggregation_Real is specified because the column used in the expression (wind) is the data type Real. You must always use the expression reflecting the data type of the column to which it is applied.
    The following expression, which specifies an aggregation of the data type Real, is displayed in the Expression text box.
    TERRAggregation_Real("output <- input1[1]",)
  9. Edit the entry in the Expression text box to calculate the mean of the value of the Y axis (wind) for each of the bins.
    The expression should read as follows.
    TERRAggregation_Real("output <- mean(input1)",[Y])
    Important: Spotfire autocorrects the function case or name to that of built-in Spotfire function names. (For example, TERR contains the function max, and Spotfire contains the function Max. ) You must overwrite this autocorrection manually to ensure that you use the TERR function case and name in your expression function.
  10. After you have edited the expression, accept the changes to return to the Properties dialog box.
    The new entry, under Visible lines and curves, for the horizontal line based on the aggregation should be displayed, and its check box should be selected.
  11. In the Properties dialog box, under One per, select the check box Color.
    This selection specifies that one horizontal line should be displayed for each of the colors used for the Color by temperature binning.

Results

The resulting visualization is displayed, showing the horizontal colored lines (one for each of the five bins), indicating the mean of each bin for the column on the Y axis (wind).

wind vs. ozone, binned by temperature, showing aggregation lines