In the
Insert Calculated Column or
Custom Expression dialog box, you can use one of the
Spotfire
statistical functions, and embed a
TERR
script in the expression.
About this task
This task uses a
sample data set Sales and Marketing, which is included in the
Spotfire
library, in the
Demo/Analysis Files/Sales and Marketing folder. This
simple example does not require statistical analysis. It is meant only to
introduce concepts and workflow. This example demonstrates inserting a
calculated column created from an expression function. You can try a similar
technique using the
Custom Expression dialog box, available by
right-clicking the axis name.
Procedure
-
Open the Sales and Marketing example data set and add a page.
-
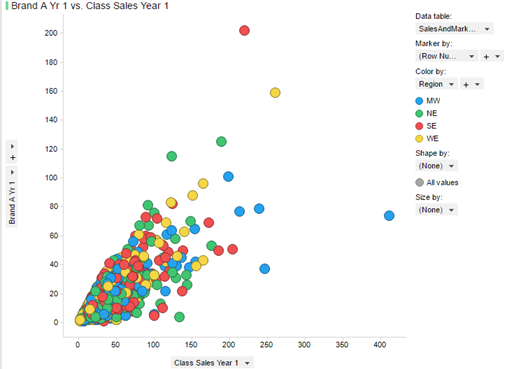
Create a scatter plot visualization, setting the X axis to Class
Sales Yr 1 and the Y axis as Brand A Share Yr 1.
The resulting visualization appears as follows, with
Color by set to Region.
-
From the menu, click
.
The
Insert Calculated Column dialog box is
displayed.
-
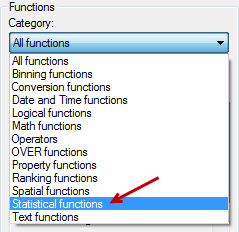
From the
Functions list box, under
Category, click the drop-down arrow.
-
From the list, select
Statistical Functions.
The
Function list is filtered to show only the
statistical functions.
-
In the list of statistical functions, find
TERR_Boolean, and then double-click it.
By selecting
TERR_Boolean, you specify that the values returned
by the call to the
TERR
engine should be returned as logical, which
Spotfire
converts to Boolean.
The expression is inserted to the
Expression text box, specifying the input name
as
input1, and the output name as
output.
-
Place the cursor at the end of the expression, inside the closing
parenthesis.
This is where you add the column to which you apply the
function.
-
From the
Available columns list, double-click Class
Change Yr 1 to Yr 2.
The column
[Class Change Yr 1 to Yr 2] is added to the
expression.
-
Add the evaluation to perform in the expression.
For this example, specify the following:
"output <- input1 > .10".
This evaluation determines which of the entries in the column
specified by the column Class Change Yr 1 to Yr 2 grew by more than 10%.
Important: Spotfire
autocorrects the function case or name to that of built-in Spotfire function
names. (For example, TERR contains the function
max, and Spotfire contains the function
Max. ) You must overwrite this autocorrection
manually to ensure that you use the TERR function case and name in your
expression function.
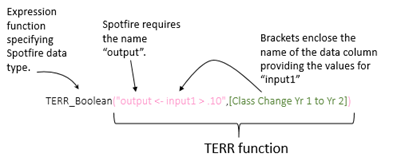
The expression function is constructed, as follows.
The
Sample result box displays a valid sample of
the result, such as
False, and the
Type box displays
Boolean.
-
In the
Column name text box, rename the column to a
friendly name.
If you do not rename it, the column name is the entire expression
function.
For the example, you could change the name to
Brand A change greater than 10%.
-
Click
OK to run the expression.
The new column created by the expression function is
displayed in the
Data
panel under
Categories.
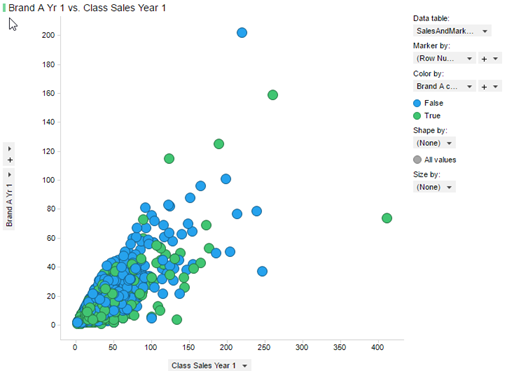
-
Select the
Color by drop-down, and from the list, select
te expression function name.
Results
The visualization
displays two colors to indicate which Brand A products increased by over 10%
(True) and which did not (False).