Spotfire® Enterprise Runtime for R

Registering the TERR Script as an Expression Function

You can create write a TERR function, register it in Spotfire to call as an expression, and then use it in any analysis from the Custom Expression and Insert Calculated Column dialog boxes. You can also edit the saved expression function from the Spotfire user interface.

About this task

This task uses as its example a data set consisting of 30 consecutive dates and their temperatures in Fahrenheit. The expression function to write and save adds a column that converts the temperature to Celsius. To work through this example, you can copy the data set from Temperature data set for Spotfire examples.
Tip: You can copy (CTRL+C) the contents of the sample data table and paste it (CTRL+V) into the Spotfire user interface.

Before you begin

Copy the sample data set into Spotfire. (You can use any data set, and you can write any expression that works with your data type and visualization. This simple example expression is for demonstration only.)

Procedure

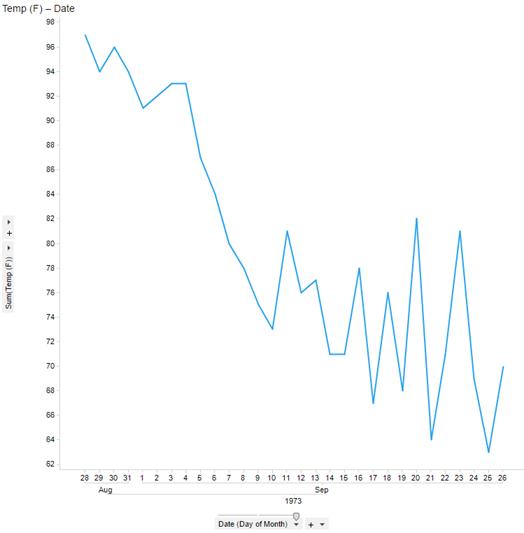
  1. Create a visualization from the data. If you are using the data in this example, consider creating a line chart with the date on the X axis and the sum of the temperature on the Y axis.
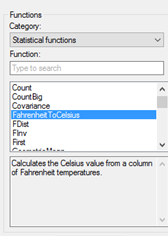
    line chart showing Fahrenheit temperature for 30 days

  2. From the menu, click Edit > Data Function Properties, and in the Data Function Properties dialog box, click the tab Expression Functions.
  3. In the Expression Functions tab, click New to open the Expression Function dialog box.
  4. Provide the metadata for the expression function.
    FieldDescription
    Name Spotfire displays this name in the function list for both the Custom Expression and Insert Calculated Column dialog boxes. For the example, call it FahrenheitToCelsius.
    Description If you plan to reuse this expression function, providing a description of its purpose, design, or use is a good practice. This description is displayed in the both the Custom Expression and Insert Calculated Column dialog boxes.
    Note: In the example, consider adding the text from the code comments (denoted by a hash mark, #) from the example data. These comments provide information and guidance about the function body for other users.
    Function type Specify whether the function adds a column or a single, aggregated value. This example specifies a column. A column specifies the same number of rows as the input.
    Return type Specify the Spotfire data type the expression function returns. For this function, set the data type to Real. See Data type mapping for more information.
    Category Specify the function list to contain the expression function. The function list is displayed in the Custom Expression and Insert Calculated Column dialog boxes. Categorizing the functions makes it easier to find different types of functions in the Spotfire user interface. By default, expression functions are listed under Statistical functions.
    See the help available from the Spotfire dialog box for more information about these fields.
  5. In the Script text box, write the function script.
    The script for the example data is written as follows.
    # Define the FahrenheitToCelsius function.
    FahrenheitToCelsius <- function(TempFahrenheit)
    {
     TempCelsius <- (TempFahrenheit - 32) * (5/9)
     TempCelsius
     }
    # Create and run the function as an expression to produce the output
    # input1 specifies the column of the data to use in the evaluation. (In this case, input1 is TempFahrenheit)  
    # output is the column containing the values calculated by the function.
    output <- FahrenheitToCelsius(TempFahrenheit = input1)
  6. Click OK to save the expression function and add it to the list of functions in the Custom Expression and Insert Calculated Column dialog boxes.
  7. Return to the Spotfire visualization, and from the menu, click Insert > Calculated Column.
  8. In the Insert Calculated Column dialog box, click the Category drop-down, and from the list, select the category you set in Statistical functions.
    The list displays the statistical functions in alphabetical order. For our example, the FahrenheitToCelsius is near the top of the list. Note that the description you provided when you created the expression function is displayed in the informational text.
    New function displayed in the list of available expression functions

  9. Select the new expression function name, and then click Insert Function.
    The function is inserted in the Expression text box. The example shows FahrenheitToCelsius().
  10. From the Available columns list, click the column to which to apply the function, and then click Insert Columns.
    The example column is Temp (F). This selection specifies that the calculation in the function is applied to each row of that column, and the new column contains the results of each calculation.
  11. In Column name, provide a friendly name for the expression function.
    For example, type Temp (C).
    If you do not perform this step, Spotfire uses the entire expression function as the column name.
  12. Review the Sample result, and then click OK to run the expression function and return to the line chart visualization.
  13. On the menu, click Insert > Duplicate Visualization.
    A duplicate of the line chart is displayed.
  14. In the data panel, select the new calculated column and drag it to the Y axis.
    The Y axis shows the values as Temp (C), or Celsius, instead of Temp (F), or Fahrenheit.
  15. Optional: Create a table visualization with all columns, including the new calculated column, and compare the values.

Results

The expression function you created is now registered in your installation of Spotfire Analyst. You can use the new expression function in other analyses with like data. Also, you can return to the Expression Functions dialog box and edit the expression function if you need to. (Any change you make to the expression function script is applied to any analysis that uses it.)