Spotfire® Enterprise Runtime for R

Mapping data with TERR and leaflet

If your data has location columns (latitude and longitude), you can retrieve data using the dplyr package, and then create a map chart using the TERR-compatible, Javascript-enabled leaflet package.

About this task

You can use RStudio to create this map chart, or you can use the TERR console and display the results in a browser. This example walks you through creating a map chart in the TERR console with data available on the internet, and then displaying the results in a browser.

The dplyr package is used to filter the original data, and the pipe operator (%>%) is used to avoid creating intermediate data objects.

Tip: If you search the internet, you can find several informative articles and samples for the packages we use in this example.
Package link Package short description
https://dplyr.tidyverse.org/ Work with data frame-like objects, both in memory and out of memory.
https://rstudio.github.io/leaflet/ Create and customize interactive maps using the Leaflet JavaScript library.

Before you begin

TERR, access to the internet, and a browser.

Procedure

  1. From the TERR console, install the dplyr and leaflet packages.
    install.packages(c("dplyr", "leaflet"))
    TERR checks TRAN and then CRAN for the packages to install, and then installs them along with any packages they require.
  2. Call the library function to load the required packages.
    library("dplyr")
    library("leaflet")
    The packages and their required packages are loaded, and messages about any object masking are displayed, along with any warnings regarding TERR differences.
  3. Load the data, and then restrict the data to Starbucks stores located in Washington state only.
    file <- "https://opendata.socrata.com/api/views/ddym-zvjk/rows.csv"
    starbucks <- read.csv(file) %>%
      filter(State == "WA")
    In this case, the data contains the location of Starbucks stores in the U.S. The source is the OpenData web site provided by Socrata. To see more information about filter (for example, filtering rows that match different conditions), see its help file in the dplyr package help.
  4. Use the leaflet package functions to draw a map, with the center in Seattle, and with the Starbucks store locations identified by markers.
    leaflet() %>%
      addTiles() %>%
      setView(-122.32, 47.605, zoom = 12) %>%
      addMarkers(data = starbucks, lat = ~ Latitude, lng = ~ Longitude,
        popup = starbucks$Name)
    Note: The addMarkers function argument popup enables the Name column (containing the store name--usually named for its location) to be displayed when you select its marker.

Results

A browser opens, and a map with the center focused on the specified latitude and longitude is displayed. The 
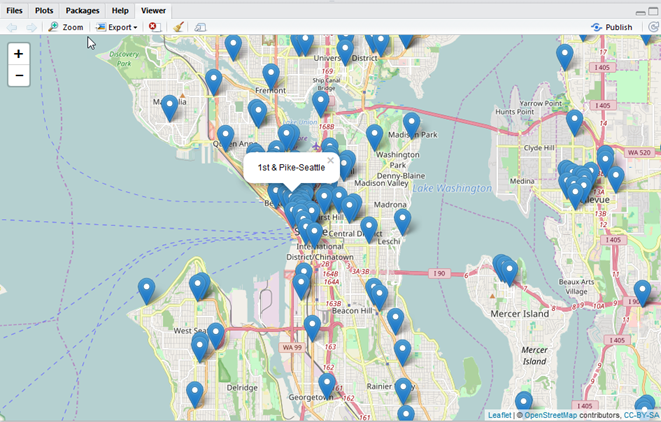
zoom property of the map is set to the specified value. Each Starbucks store in the Seattle area is indicated by a blue marker. If you click a marker, the value of the Name column is displayed in a pop-up window.

map showing starbucks stores

What to do next