Accessing Data in TIBCO Spotfire
Data can originate from a multitude of different sources and the trends move towards a general supply of more and more data. It can be a matter of traditional enterprise sources, relational databases, cubes, NoSQL, machine generated data, cloud, streaming data, dark data, unstructured data, big data in Hadoop, Web Services, etc. With TIBCO Spotfire you have the perfect environment for analyzing any type of data, from any source.
There are a number of different ways available to access your data:
Direct file access (.xls, .xlsx, .xlsm, .csv, .txt, .mdb, .mde, .sas7bdat, .sd2, .udl, .shp). You may also have access to additional file sources, if such have been set up by your company.
Data connections via connectors to external systems. The data connections are well suited to handle big data and each connector is tailored for its particular source. Custom queries can be created in order to fine-tune the data returned or the performance of the query.
TIBCO Spotfire Information Services allows you to set up any JDBC data source and create information links, which are predefined SQL queries that can be analyzed in-memory. Information links can include prompts to enable the end users to select their own data and procedures can be added both as pre-/post- or main queries. A built SQL query can easily be edited for further tweaking of the result. Information links are not available in a Cloud environment.
TIBCO Data Virtualization, (also branded as Spotfire Advanced Data Services), is an interface to other third-party applications, commonly used for access to Web Services.
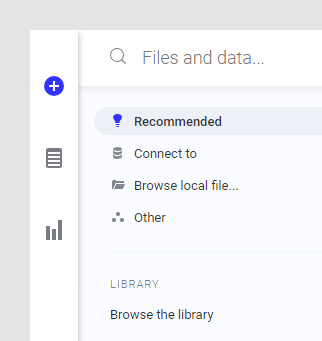
You can access all types of sources from the Files and data flyout on the authoring bar:
Data from multiple sources can be combined into a single Spotfire analysis and analyzed using a number of different visualization types. If Spotfire detects that new data is similar to previously added data, you will get a recommendation to join your data into a single data table when adding new data to an analysis.
Data from different sources can be shown in a single visualization, or in many. Different data tables can be related to each other so that filtering in one affects the values in another data table, but they can also remain completely separate: there are no limits.
Data Loading and Calculations
Aggregations and calculations on your data can be done either using the built-in Spotfire data engine or, for data connections, using the processing power of an external system.
When you are working with data in-memory (which applies to text files, Excel files, imported data connection tables, information links, etc.) you have access to all the functionality of Spotfire via the built-in data engine which is available to all Spotfire users, either in the Windows client or, for web client users, on the server. You have the opportunity to use all columns as filters and you can perform many types of calculations. You can choose to add data as new rows or as new columns within a data table, and you can add transformations to extend or clean up the data.
You can also use any of the tools within Spotfire to cluster data, calculate new columns, bin columns into suitable groups, make predictions, etc. See Working with Large Data Volumes for some tips on how to improve the performance of an analysis with lots of data.
When a data connection to an external source is set up, all calculations can be done using the external system and not with the Spotfire data engine. This allows you to work with data volumes too large to fit into primary memory and take advantage of the power of the external system. When working with external data connections, you access only the current selection of data and all aggregations and calculations are made in-database (in-db).
When a visualization is configured to use in-db data, the visualization queries the external data source directly. Every time a change is made to the configuration of the visualization, e.g., a measure is defined on the Y-axis or a categorical column is added, a new query is sent to the external data source resulting in new, aggregated data.
In some cases, the data in a database is modeled as a star schema or a snowflake, also known as a multidimensional model. If this is the case, you can reuse this model, the relations and constraints defined in the database, to configure your analysis. If no relations have been set up, it is possible to define those when selecting the data to retrieve for a certain connection. See To add relations for more information. By using constraints and relations that have either been predefined in the database or created explicitly by a configurator, TIBCO Spotfire can arrange data from multiple sources so you can view the result as a whole.
When working with in-db data it is the connector and the underlying data source that determines which aggregation methods are available. However, the flexibility of custom expressions and the ability to create expressions based on already aggregated data with the “THEN”-keyword gives you endless opportunities to model the data the way you want it. See Custom Expressions below for more information.
Streaming data is just a special case of in-database data where the data is updated in real-time, or at any frequency, depending on how you configure your connection to the streaming data. Connections to streaming data work the same way as any other connection.
On-demand
When data from a non-cube data connection or an information link is to be added to the analysis as a new data table, you have the option to either load all data at once, or to load data on demand only. This is applicable to both in-memory and in-database data (for data connections). Your analysis can benefit from on-demand loading when you have access to massive amounts of data, but you only need to work with some parts of the data at a time. When setting up an on-demand data table you can specify conditions based on one or more other data tables to control what to load. You can also start by letting an on-demand data table be the first (or only) data table in the analysis if its input is defined by a document property, a variable you can define yourself.
On-demand loading can be regarded as a way to filter data; it is basically a WHERE-clause which dynamically limits what is read and used in calculations.
Custom Queries
When working with data connections to relational databases or other non-cube data sources, you get the option to select one or more tables from the data source in the modelling view. Here, you might also have the option to create your own custom database query, depending on your licenses. A custom query results in a custom table which in turn can be used to set up a view in the selected connection in the same way as you would do with other database tables. Queries are written in a language that the database understands. For example, for a Microsoft SQL Server database, you would write your custom query in the Microsoft SQL Server dialect of SQL.
Information links also give you the possibility to create custom SQL.
|
Connectors |
Advanced Data Services |
Information Services |
In-database |
● |
● |
- |
In-memory |
● |
● |
● |
On-demand |
● |
● |
● |
Custom queries |
● |
- |
● |
Choosing and Combining Connectivity Methods
Which method to use for bringing your data into TIBCO Spotfire depends on your data. Is it big data from a relational database? Excel files on your local machine? Data in the cloud? Spotfire gives you the freedom to handle it all.
When it comes to big data and data in external systems, a data connector for your data source is most of the times the preferred choice, because the connectors are tailored for the specific system and they give you the flexibility to choose all types of load methods.
A TIBCO Spotfire analysis is the perfect way to combine data from multiple sources into a single analysis. In-memory data tables can be merged via Add columns or Add rows, or you can use a small in-memory data table as a starting point and fetch detailed information via an external in-db data table which is loaded on demand only. Data from different sources can be viewed both separately or combined into a single visualization.
Updates
With TIBCO Spotfire you can always make sure that your data is fresh, if this is desired. You can choose to refresh a single data table, a part of a data table, or to reload all data in the entire analysis, depending on the circumstances.
Linked or Embedded Data
When you are saving an analysis you can decide how data should be handled. For in-memory data there are two options available: Linked or Embedded. Which to choose depends on the data you use and who the end users of the analysis are, and also what data sources they have access to. Use linked data to always retrieve the latest data from the data source and keep the file size to a minimum. The linked option also gives you the flexibility to always link parts of a data table, whereas other parts are stored in the analysis file.
Use embedded data to include a snapshot of the data in the analysis file so that the analysis file is self-contained with data.
In-database data can never be embedded; it is always fetched directly from the database.
When you save data stored in the analysis, you can still manually reload data from the original data source (if this is available). This means that stored data may not necessarily be fixed and unchanged during the lifetime of an analysis. If a reload is done, then the latest data from the original source is fetched into the analysis. Hence, the analysis will contain a snapshot of the data from the latest time of refresh and save.
Scheduled updates are an approach that you can use to reduce the time it takes for a user to open certain analysis files. This is done by pre-loading analysis files on the Spotfire server before a user attempts to open them.
Scheduled updates are most efficient if you have analysis files with linked data (from a data connection or any other linkable data source), that are updated regularly with large amounts of new data. Often such updates occur during the night, and the following morning users want to open the corresponding analysis files to view the latest data. If that data has already been pre-loaded, the analysis will open much faster.
The same goes for a large analysis with lots of data, that users might open several times during the day to quickly check for figures or similar. Instead of having to load this into memory every time a user opens the analysis, you can make sure this analysis is already pre-loaded from the data source, ensuring a rapid response for the users.
See the TIBCO Spotfire Server and Environment – Installation and Administration Manual for more information about scheduled updates.
Modeling & Cleansing
You have a multitude of opportunities to cleanse, modify and enhance your data with TIBCO Spotfire.
Reuse Database Models
If you have spent a lot of time setting up relations and building models in a database you can naturally take advantage of this work in TIBCO Spotfire. All relations and constraints defined in the database can be used when defining the views to look at in the data connection configuration.
Data Wrangling
The Expanded Data in Analysis flyout gives you the possibility to directly change things like the data type, formatting and categorization of a column. Depending on the column type you may also have the option to split a column into multiple columns, or, to replace empty values with a value. Some types of cleansing might also be displayed as a recommendation applied using a single click.
Custom Expressions and Calculated Columns
Custom expressions allow you to create your own aggregation methods for the visualizations, based on the columns in the data tables and the expression functions available. In-memory data tables can always use all functions in the Spotfire expression language, whereas the functions available for the in-db data tables are those supplied by the current connector only. However, the already powerful custom expressions can be further enhanced by using the THEN keyword to add parts of the expression to be calculated on the already aggregated data. This way, you can model your data as you see fit and perform an endless number of calculations.
Custom expressions are calculated on the fly depending on the currently filtered values in the included columns of the expression. They only affect the axes they are used upon.
Calculated columns are very similar to the custom expressions, but they instead use all of the values in the included columns, and a new column is added to the data table with the result of the calculation.
Transformations
Sometimes the data you want to analyze in Spotfire is not in the most appropriate format, or may even contain errors. It can therefore be useful to perform transformations on the data in order to get the best results from the analysis. There are several methods that can be used to transform your data. For example, you can calculate and replace columns, change column names or data types, perform pre-defined statistical calculations using data functions, normalize or pivot/unpivot data.
Transformations can be applied either when data is loaded, or later on, when the data has already been loaded into Spotfire. You can perform transformations on most of the "regular" column types that are loaded into Spotfire, but not on certain column types whose content changes depending on selections you make in the analysis.
Note: Transformations are not applicable for in-database data, but if you select to import the data from a connection you can use transformations just as with any other data source.
The prospect of using the statistical power of TIBCO Enterprise Runtime for R for Spotfire in data functions also gives you unlimited potential to set up the transformation of your choice.
Sharing
Sharing Data and Models
Once you have configured data and models the way you want it, you can save the configuration so you never need to redo it again. All data sources, data connections, information links and analyses you have created can be saved in the library for reuse by yourself or by others, thus reducing the start-up time for creating a new analysis to a minimum.
Sharing Analyses with Data Sources and Connections
When creating analyses to be used by others you must always think about their access to the data sources in use. Always make sure the end users of your analysis have access to the same data sources as you do. Permissions to analyses, data connections and information links are handled using the Library Administration tool in an on-premises environment.
If all users do not have access to all of the original data sources, you may need to save some parts of your data tables stored in the analysis. There may also be user authentication limitations directly on the data source itself.
Personalized Data
Data tables based on custom queries or information links may be set up to use parameters for personalized queries, so that all end users of the analysis get access to different subsets of the data. See Creating Custom Queries and Personalized Information Links for more information. It is also possible to load different data for each user when using scheduled updates.
Authentication
Authentication and access to data can be controlled on several different levels in TIBCO Spotfire. The access to the application itself can be set up to use NTLM or Kerberos for single-sign-on, or use the Spotfire Server database authentication. Access to data sources is generally controlled via permissions set for user groups on the library folders where data files, data connections, information links or analyses are stored. If you are using data connections to get your data, each connector might also have a number of different authentication methods available.
Data Access Concepts in TIBCO Spotfire
Data connections
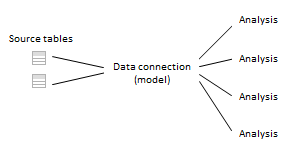
A data connection in TIBCO Spotfire is a specifically configured object containing the actual connection to a data source as well as the modelling to form one or more unities of data which can be viewed in Spotfire analyses.
Use of data connections is the most flexible way of adding data, if a connector for your data source is available, because it allows you to add and combine data any way you like: in-database, in-memory, on-demand, custom queries, etc.
Note: Which external data connectors you have access to may differ. See Connectors Overview for more information.
When a data connection is added to the analysis, all views in the connection will be available within the analysis until the connection or a view is removed using Data > Data connection properties, regardless of whether the view is added as a data table or not. Therefore, you should use the option Linked copy from data table in analysis (see below) to add more views from an already used connection rather than adding another connection to the same source. See What is a Data Connection? for more information.
Linked copy from data table in analysis (Data from current analysis)
This option is available from the Files and data flyout when selecting the Other option. It allows you to add a new data table based on a data table already in the current analysis. For example, you may want to pivot or otherwise transform the data in an already existing data table, but you also want to keep the original data in the analysis.
This option is also the preferred option if you decide to add another data table based on a view from a previously added data connection.
Data sources
A data source in general is the source from which the data origins, such as a file or a database.
In TIBCO Spotfire, data sources can also be specific objects set up by the data modeller, to be used by data connections or by information links. In this case, the required information needed to link to a database is saved in a data source object. The two different types of data source objects may be stored in the library (always if it is an Information Designer data source but not necessarily for connection data sources, which may also be embedded into the analysis). However, the two different types of data sources (Information Designer data sources and connection data sources) cannot be used for the other type of data access.
 A connection data source can be
used to fetch data via one or more data connections. A data connection
can produce one or more data tables. See What
is a Data Connection? and What
is a Connection Data Source? for more information.
A connection data source can be
used to fetch data via one or more data connections. A data connection
can produce one or more data tables. See What
is a Data Connection? and What
is a Connection Data Source? for more information.
 A data source
used by Information Designer can be used in multiple information links
but each information link produces only one data table. See
Data
Sources Overview
for more information.
A data source
used by Information Designer can be used in multiple information links
but each information link produces only one data table. See
Data
Sources Overview
for more information.
Data tables
All data that you work with in TIBCO Spotfire is included in a data table, but an analysis can contain more than one data table.
A data table can be either data loaded from an external source, or new data created within the application. Columns or rows may also have been added to a data table from other sources. A data table has zero or more columns and zero or more rows.
A visualization can be based on more than one data table, but one of the data tables is always the main data table. The main data table defines what a row is in an unaggregated visualization. Also, the columns in the main data table are the columns that can be used to group the visualization in different ways.
In-memory data tables loaded from an external source can be linked or embedded. Linked data tables can be loaded completely into the application, but if the source is an information link or a data connection they can also be configured to load data on demand only.
Data tables can be related to each other, using primary and/or foreign keys (key columns), but they can also be unrelated.
Information links
An information link is a structured request for data which can be sent to the database. These specifications include one or more columns, and may include one or more filters. Information links can include prompts to enable the end users to select their own data and procedures can be added both as pre-/post- or main queries.
Load method
When you add a new data table into the analysis, you may have the option to change the load method in the final step of the add data workflow (the summary view). There might be three different options available: Import, On-demand and External. The option to change the load method is only applicable when working with data from connections to external systems. File data, clipboard data and information links is always imported into the internal data engine. On-demand is an alternative available for data from information links or data tables in data connections. If you choose to load data on-demand, you also need to specify how to configure how to control the loading of data (using the On-Demand Settings dialog) .
Note: When you are adding data from data connections, the views in a connection may have been restricted to only allow a certain load method. This is specified when setting up the data connection in the Views in Connection or Data Selection in Connection dialog. Data connections based on stored procedures or SAP HANA Information views only support the Imported data option.
Relations between data tables
To specify how the new data tables should be related to each other or any previously loaded data tables in your analysis, open the Manage Relations dialog via the Data Table Properties dialog.
File data
File data is any type of data opened from a file. To open local files, you use the Browse local file option in the Files and data flyout.
Note: To be able to open SAS data files (*.sas7bdat) directly into TIBCO Spotfire, the SAS Providers for OLE DB 9.22 or later must first be installed on the client machine (see http://spotfi.re/sr and click on TIBCO Spotfire® Analyst & Desktop for more information). *.sd7 files can also be opened provided that they first are renamed to *.sas7bdat.
In the Spotfire library, you may have access to SBDF data files which can be found by searching or by browsing the library. Which library folders you have access to is controlled by group privileges.
See also: