The actual values of the data rows that are included in
visualization items (like bars in a bar chart or sectors in a pie chart) can be
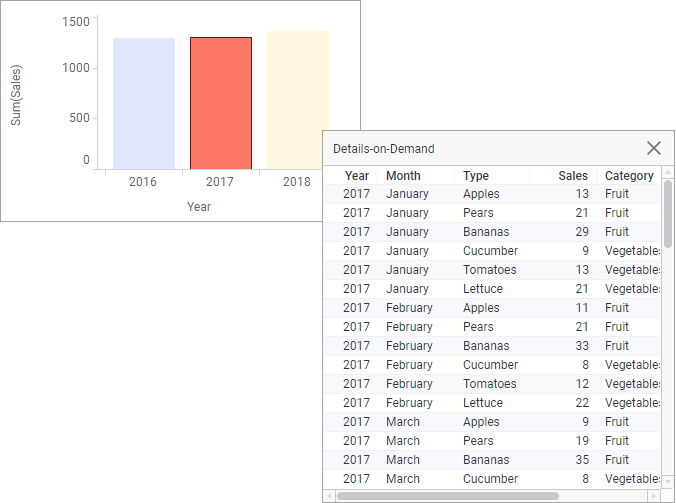
viewed in the
Details-on-Demand panel.
About this task
To select which
items the row values should be displayed for, you mark them. If you mark, for
example, a bar in a bar chart, all the data rows included in that bar are
listed in
Details-on-Demand panel as shown below.
Before you begin
A visualization is
created.
Procedure
-
If the
Details-on-Demand panel is not visible, select
on the menu bar.
The
Details-on-Demand panel is shown on the
right-hand side of the page.
-
In the visualization,
mark the
items which you want to display row details for.
The data rows included in the marked items are listed in
the panel.
Note: When a visualization combines data from more than one
visualization, the Details-on-Demand will show data from the
main data table only. For analyses with
multiple data tables, settings for the Details-on-Demand must be defined for
each data table.
Tip: As long as you work with imported data and you use
the Details-on-Demand to view information about more than one row, you can also
use the Details-on-Demand as a starting point when
replacing values in a data table.