Grouping categories
Sometimes a column in your data contains many categorical values, but some of them are not important to display as separate values. Then you can group these values into a new categorical value.
For example, assume your visualization shows sales of apples, pears, oranges and limes. However, you are interested in citrus fruit sales compared to apples and pears sales. Then you can create a new category value, "citrus", that contains both oranges and limes.
When creating visualizations, you usually split data into different category values using various axis selectors. You may for example split the data by selecting a category on the X-axis, Y-axis, or the Color axis. When you find it beneficial to group category values on an axis to get fewer categories, you indicate which categories via marking items in your visualization.
An example explains in more detail.
The bar chart below shows sales of toys at four different store locations. Assume you are interested in presenting the total sales at the US east coast, and therefore the east store locations should form a group (Boston and New York).
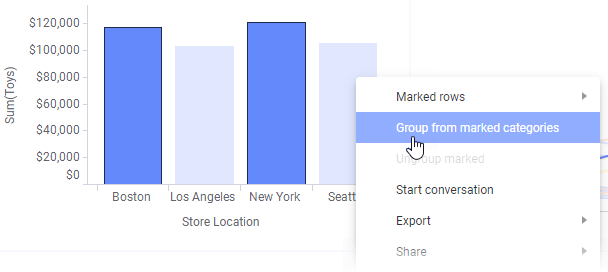
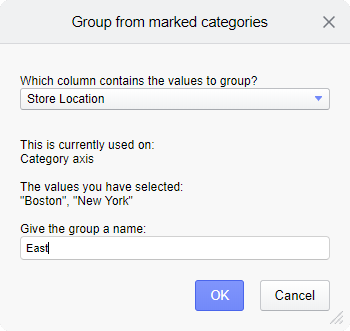
Select the column from which values should be grouped. In this case the only splitting made is the Store location column on the Category axis, and the values you have pointed out by marking are "Boston" and "New York". Also give the group a suitable name.
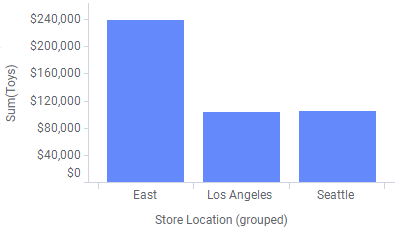
If you want to, you can create more groups, for example a "West" group consisting of Los Angeles and Seattle, or even a group where "East" is included.
See also Grouping from marked categories and Handling differently spelled values.