Grouping from marked categories
Sometimes a column contains many categorical values, but some of them are not important to display as separate values. Then you can group them in a new categorical value.
For more information, see Grouping categories.
Procedure
Results
Note: Grouping can be
undone, see
Ungrouping categories.
Example
The example shows first how to group categories split by the Color by axis and then how to group categories split by the category axis.
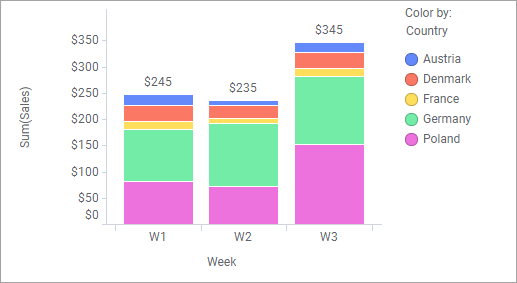
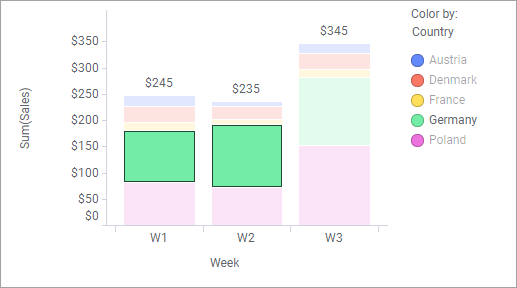
In the bar chart above, weekly sales figures are displayed, split per
country. As sales figures in Austria, Denmark and France are quite low in
comparison to Germany and Poland, you want to gather them in a group. To point
out these countries, mark their segments. (Below, the countries are marked in
the left bar, but you can mark country segments in any bar.) Note that each bar
segment represents data split by both week and country.
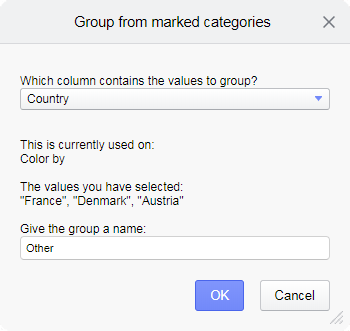
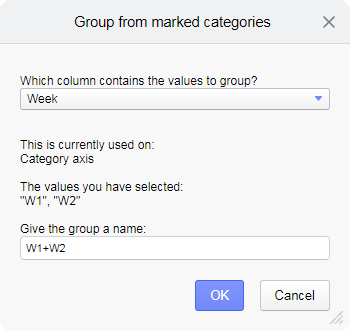
Then right-click the visualization, and select
Group from marked categories. Since each of the
marked segments is determined by Week as well as Country, you have the option
to choose from which of these columns you wish to group values. This time
select Country:
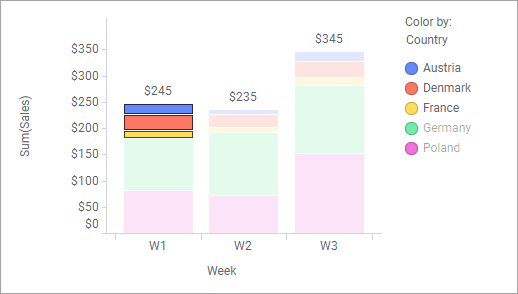
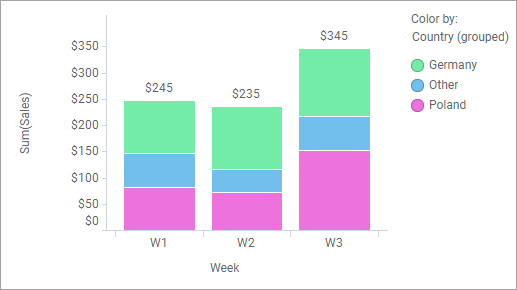
The grouped countries are here named "Other". See the result with the new grouped column applied on the Color by axis:
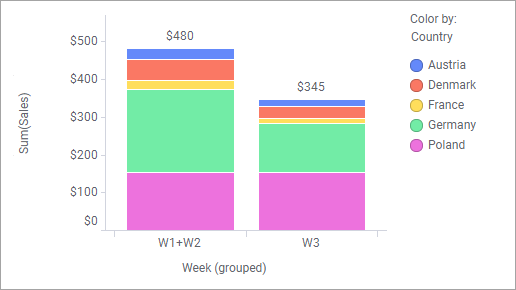
If you wish to group weeks instead of countries, say W1 and W2, mark
segments with these values. (You can mark any segment in the W1 bar, or the
entire bar, and any segment/the entire bar in the W2 bar.)
Then right-click and select Group from marked categories.
Then right-click and select Group from marked categories.
Here the values to group are retrieved from the Week column, and the
created column grouping W1 and W2 is applied on the category axis.