Running data functions in Spotfire web clients
Data functions that perform different types of calculations can be created using the installed Spotfire client. If the data function is saved in the library, anyone with authoring licenses plus the Execute Data Functions license feature (under Spotfire Advanced Analytics) can use the data function when creating an analysis. Consumer users can benefit from the results of the calculations when interacting with the finished analysis.
Before you begin
Procedure
-
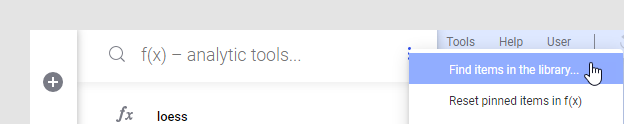
Use search to find a specific data function. Note that search in
the
f(x) flyout will only search among the pinned
data functions in that flyout; you must either start in the
Files and data flyout or use the menu in the
search field and select
Find items in the library to actually search
the library.
Tip: When clicking Files and data , you can find all data
functions in the library by entering type:datafunction in the search field, and
limit further by typing a part of the name. See
Searching the Library
for more details.
, you can find all data
functions in the library by entering type:datafunction in the search field, and
limit further by typing a part of the name. See
Searching the Library
for more details.
-
If the data function needs some configuration, the flyout will
show a list of the information you should provide. Click on each item to expand
and make the selections needed.
Tip: If there are many inputs in your selected data function, and only some of them are required, you can click Always show required inputs first to move optional inputs to the end of the list and hide them.
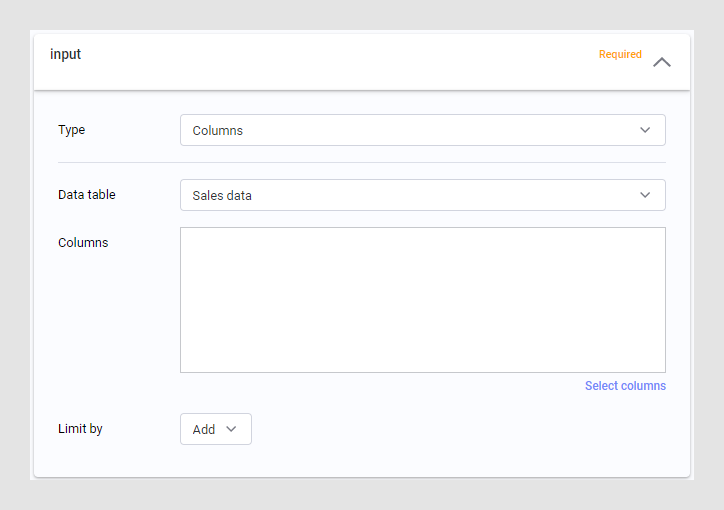
It is the author of the data function that determines what the data function will do and what it needs to be able to perform its function. In some cases, you might need to select a data table, in others, you would type a value, or select one or more columns. You must provide all required options to be able to continue, but you might also be able to provide optional configurations, such as threshold values or similar.If you need more help understanding the different input or output types, see Configuring data function parameters.
Results
Depending on the type of data function and what the results are, the analysis will be updated and ready to be opened by Consumer users once it has been saved in the library.
Tip: When a data function instance has been added to an
analysis, and the outputs are columns or rows used in a visualization, you can
tweak your input values directly from the
visualization, and quickly try out different input values. Even more editing
options are available when looking at
Data functions in the Data canvas.