The expanded data in analysis flyout
If you click on a column in the Data in analysis flyout, the flyout will expand and either show you recommendations or details about the selected column.
If the flyout is not expanded automatically, click
Expand for details and recommendations
 , to the right of the
flyout.
, to the right of the
flyout.
The two views of the expanded flyout have different purposes:
- Details on selected column gives you an overview of the values in a certain column. When you are in the details view (the column view), you can perform some data preparation and cleansing operations which can help you getting visualizations the way you want them.
- Recommendations based on selected columns gives you tips on visualizations or other operations that can help you analyzing the columns selected in the flyout. You can double-click or drag a recommended visualization to the analysis.
Example: Details on selected column

The details view for a column will look different for different types of columns. This example shows a string column.
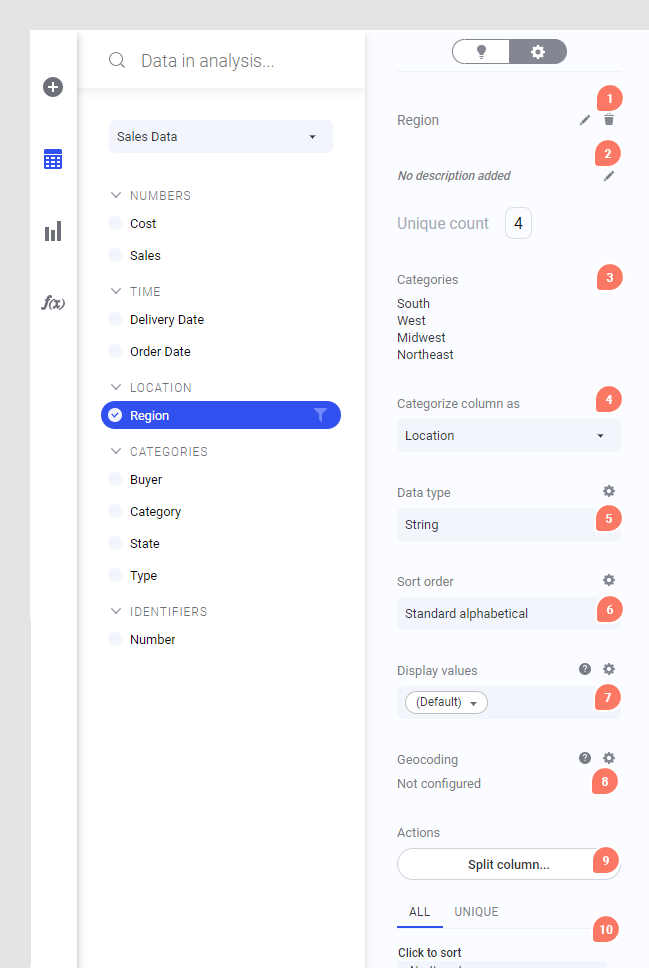
- The column name can be
changed by clicking the
Rename column button
 , and typing the new
name.
, and typing the new
name.
- You can add a description to help others understand the contents of the column and how to use it in the analysis.
- Depending on the data type
and categorization of the column you can see different statistics.
Tip: If the statistics section shows a histogram, you can click on the histogram in the column view to add a similar visualization to the analysis.
- You always have the possibility to change the categorization of the column. A good categorization can help you get better recommendations.
- The data type can always be changed (but for calculated columns you edit the expression to change the data type rather than using this drop-down list).
- You might also have the opportunity to change things like the sort order or formatting of the column, or, you might be able to handle empty values in the column. The preferred aggregation method (for numerical data) can be specified to improve recommendations and make it faster to work with the column in visualizations. Which options are available depends on the column type.
- Display values allows you to show values from a different column or expression on categorical axes and in filters. See Setting display values based on other columns for more information.
- Some columns can be used for placing your data on maps. Read more in Geographic location and geocoding.
- You might also have access to additional actions that are specific for the data type of the column, such as the Split column action that can be used to split string columns.
- At the bottom of the column view you see the contents of the column; either all values or unique (distinct) values only.
Example: Recommendations based on selected columns

If you select multiple columns in the flyout, you will get recommendations on how you can visualize those columns together:
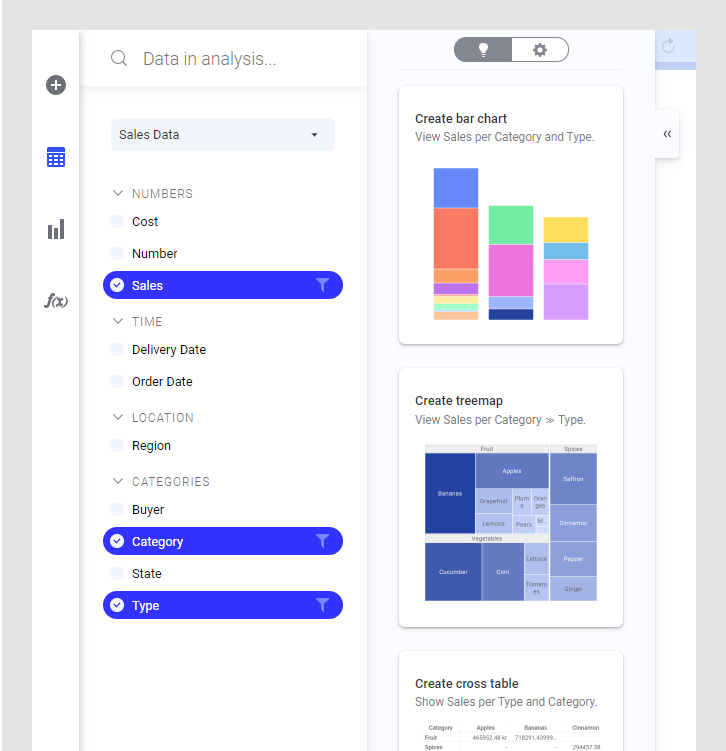
Click or drag a recommended visualization to the page to add it to the analysis.
You might also get other types of recommendations here, such as the option to link two similar data tables to each other (add a relation), so that markings in visualizations based on one of the data tables also affect visualizations based on the other data table.