Setting display values based on other columns
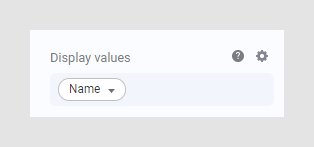
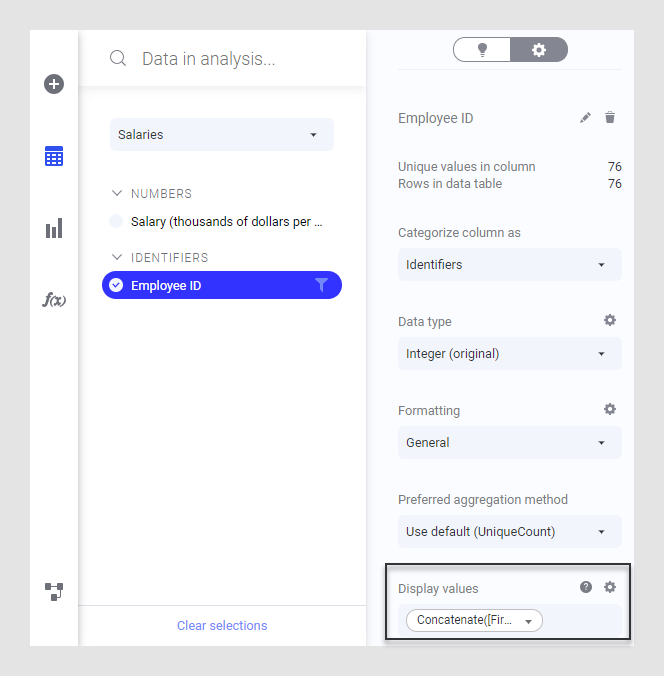
Sometimes, you might want to show other values than the ones that actually define an axis as the display values. Display values can easily be configured in the expanded Data in analysis flyout.
About this task
Display values are configured in the expanded Data in analysis flyout. Only string columns or expressions are allowed as display values.
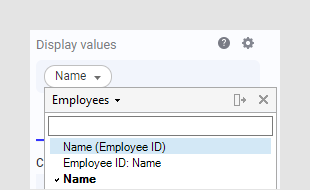
When defining display values and there is a single matching string column available in the target data table, you can choose to show just the value from the other column, or a combination of the old value and the display value from the other column:
It is possible to specify similar configurations even if the shortcut
options are unavailable. Do it by defining a custom expression on the display
value column (such as,
Concatenate([Employees].[Employee ID],":
			 ",[Employees].[Name])
). Note that expressions that mix columns from
multiple data tables are not supported.
To use column values from a different data table, there must be a column match between the two data tables. This is often created automatically (for example, if the name and data type of two ID columns in the data tables are the same) but it is also possible to configure specific column matches using Spotfire Analyst. See Multiple data tables in one visualization for general information about matching data tables.
Procedure
-
On the
authoring bar, click
Data in analysis
 and click on the column of
interest.
This should be the column you want to change the display values for.
and click on the column of
interest.
This should be the column you want to change the display values for. -
In the expanded flyout,
make sure that
Details on selected column
 is selected.
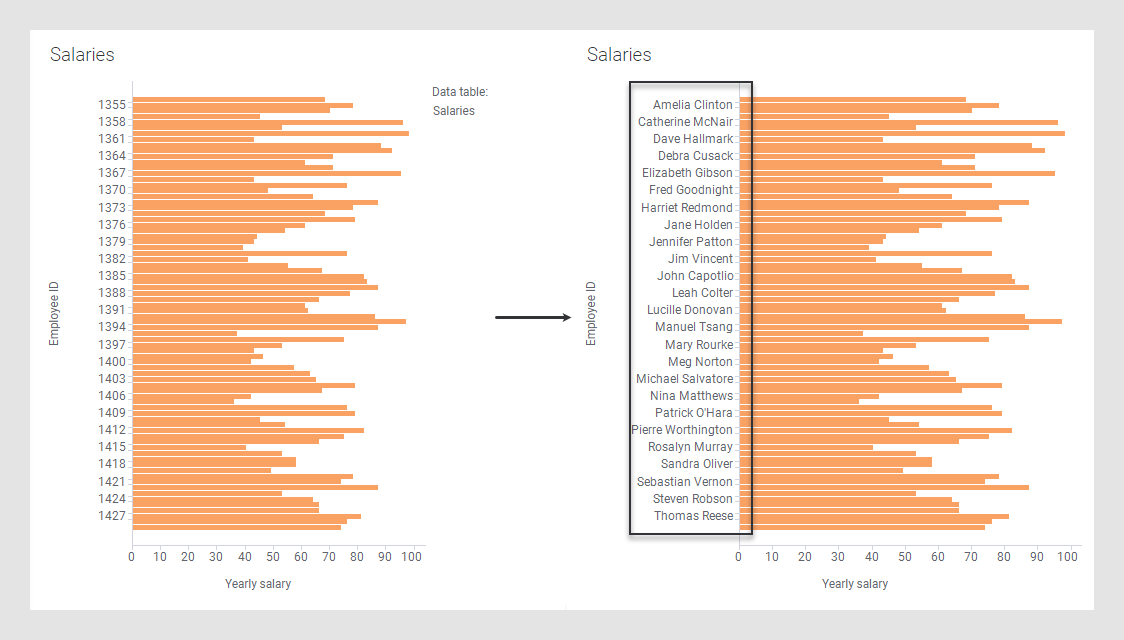
Example
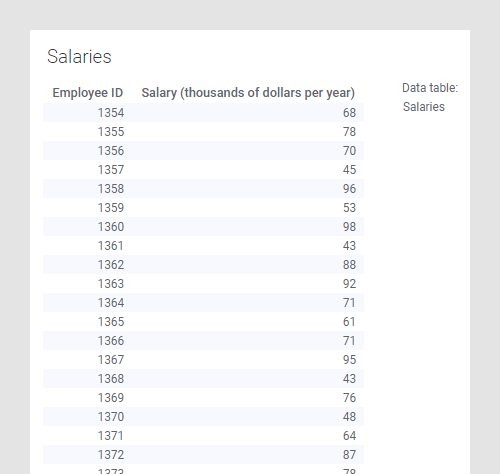
In this example, you have two different data tables in the analysis; the first one contains the salaries for a number of employees, identified using the employee number:
The second data table contains a mapping of the employee number to the first name and last name of the employees:
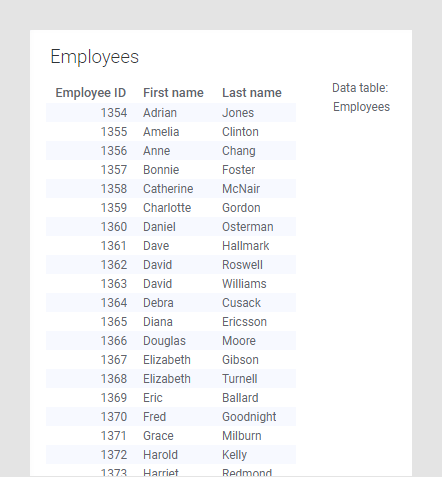
Concatenate([Employees].[First name]," ",[Employees].[Last
		  name])
) you will see which employee has which salary directly:
See also Sorting columns with display values.