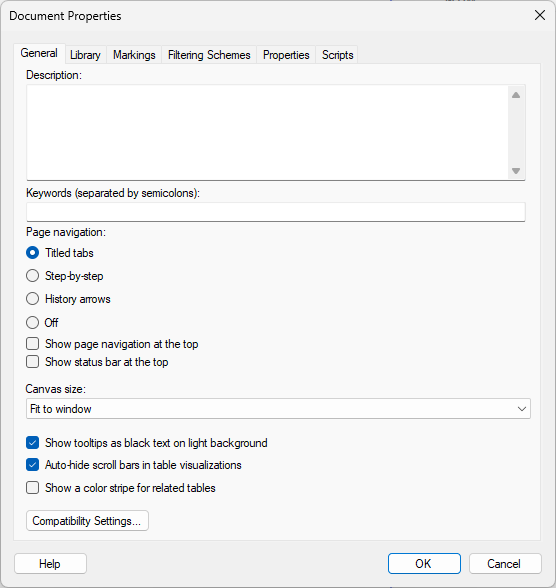
The General tab of the Document Properties dialog is where you can add a description of the analysis and keywords to describe the content of the analysis and specify what kind of page navigation to use in the analysis. Settings for adapting the analysis to different screen sizes are also provided.
To reach the Document Properties dialog:
On the menu bar, select File > Document properties.
Select the General tab.
General Tab
Option |
Description |
Description |
An optional description of the analysis. The description could contain detailed information about the analysis enabling quick overviews. |
Keywords
(separated by semicolons) |
Keywords specific to the content of the analysis. Keywords are separated by semicolons. This means that if you write "sales representatives; cost" it will be interpreted as two keywords, "sales representatives" and "cost". Keywords are used to enhance organization and search capabilities. |
Page
navigation |
Determines which type of page navigation to use in the analysis. See Pages to learn more about the different navigation modes. You can change the default page navigation for all new analyses on the Document page in the Tools > Options dialog. |
Titled tabs |
Shows all pages as separate tabs, which can be dragged and dropped to change the order of the pages. See also Guided Analysis |
Step-by-step |
Shows all pages as numbered links to support a specific flow throughout the analysis. See also Guided Analysis |
History arrows |
Hides the page navigation, except for the page history arrows. Use this mode if you want to create your own flow throughout the analysis, by adding actions directly on the pages, but still want to allow the user to go back to previously visited pages. See also Guided Analyses. |
Off |
Hides the page navigation completely. Use this option if you want to handle the navigation flow entirely by adding actions on the pages. See also Guided Analyses. |
Show page navigation at the top |
Select the check box if you want the page navigation to be placed above the visualizations in the analysis. |
Show status bar at the top |
Select the check box if you want the status bar to be placed above the visualizations in the analysis. |
Canvas
size |
Determines the size of the canvas, where visualizations are shown. Use Fit to window to automatically resize the area after the current size of the Spotfire window. If you are preparing an analysis for a different platform than the one you are currently using, you may want to lock the area to a specific size. For example, use iPad Landscape or iPad Portrait to reduce the available size for each page and optimize the analysis for that platform. An administrator can define other preset sizes using Administration Manager under Preferences > [Group] > Application > ApplicationPreferences > Fixed Visualization Area Sizes. Tip: When Custom size... is selected, the current canvas size is shown by default, if no other custom sizes have been used previously. Tip: The canvas size is persisted in bookmarks so a set of bookmarks with different layouts can be used to switch between area sizes. Note: It is possible to, on a page basis, specify a minimum width and a minimum height, which the size of the canvas area should not fall below. For more information, see Details on Page Layout Options. If you use the iPad Landscape, iPad Portrait, or Custom size options, any minimize size specification made on page basis will be overridden. |
Show tooltips as black text on light background |
Select the check box if you want to display tooltips as black text on a light background rather than the default white text on black background. |
Auto-hide
scroll bars in table visualizations |
Select the check box if you want scroll bars in tabular visualizations to be displayed only on mouse-over. If you clear the check box, then scroll bars will always be shown in tabular visualizations where some of the content does not fit on screen. |
Show
a color stripe for related tables |
If you want to keep track of which data tables are related, select this check box. A common colored stripe will appear on the title bars of the visualizations based on related data tables. Also filters in the Filters panel from related data tables (which may affect each other when they are manipulated) are indicated with this color. |
Compatibility Settings |
In some versions of Spotfire, changes to functionality are introduced that not always fit with legacy documents that were created using earlier versions. For example, in version 10.8, changes to the "limit data using marking feature" were made, and in 11.4, changes were made to how data is loaded when opening a document. If needed, click to open the Compatibility Settings dialog and revert to the previous behavior for a specific feature. |
See also:
Details on Document Properties - Library
Details on Document Properties - Markings
Details on Document Properties - Filtering Schemes
Details on Document Properties - Properties
Details on Document Properties – Scripts