(Row Count)
You select the (Row Count) option in column selectors when you want to display how the rows are distributed between different categories in a data column.
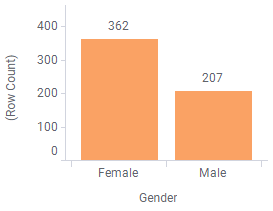
For example, the data table used in the bar chart below contains a 'Gender' column, whose values are Female or Male. If you select (Row Count) on the Value axis, the bars display how many were women and how many were men in the 'Gender' column.

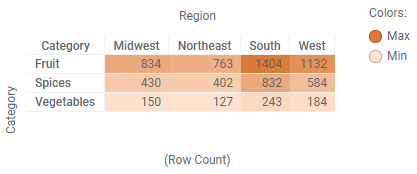
Another example of using the (Row Count) option is shown below. The cross table is based on a data table containing sales figures for fruit, spices, and vegetables in four different regions. Using the (Row Count) setting on the Cell values axis, the cross table displays the number of sales transactions made per category and region. For example, 834 of the data table rows were fruit transactions in the Midwest region.

Furthermore, the result from the (Row Count) setting is used indirectly for coloring the cross table cells. This is because the Color by axis in the Properties popover is set to (Cell values).