All()
You use the All() navigation method in an expression, when you want to reference all the nodes on an axis.
This is exemplified by the red rectangle below.
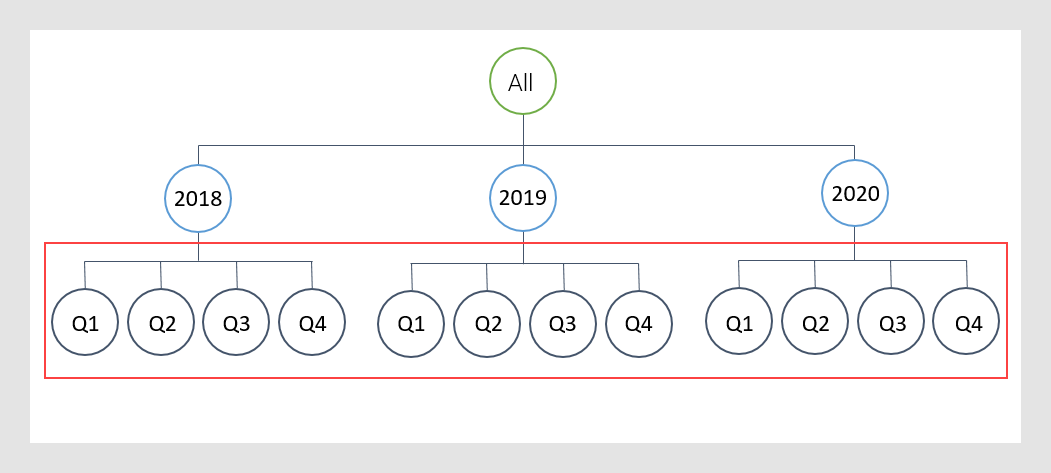
Referencing all the nodes within the rectangle means that the slicing into the 12 nodes in fact will be ignored. Consequently, the All() method is not very useful in itself. However, it is often used in combination with other methods or aggregations, for example, when calculating percentages of a whole. See the examples below.
Examples
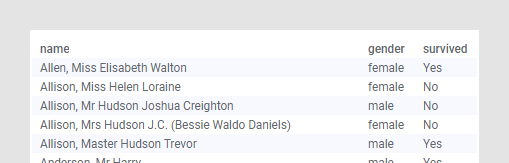
In the following examples, survival statistics from the Titanic catastrophe are used.
Example (only the category axis is used for slicing the data)
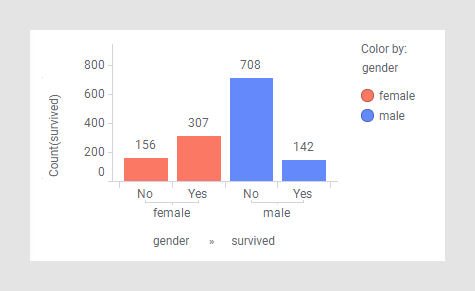
The bar chart displays the number of women and men, who died and survived in the catastrophe.
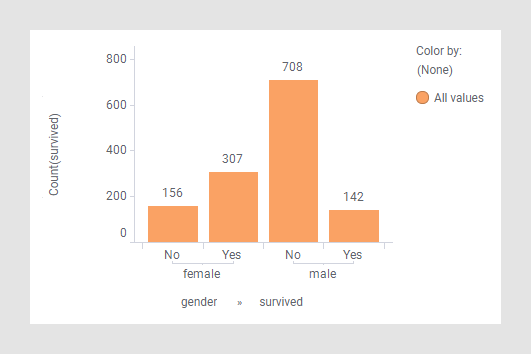
Assume you want this information expressed in percent instead of absolute numbers. Add the following expression on the value axis to calculate the different parts of the whole:
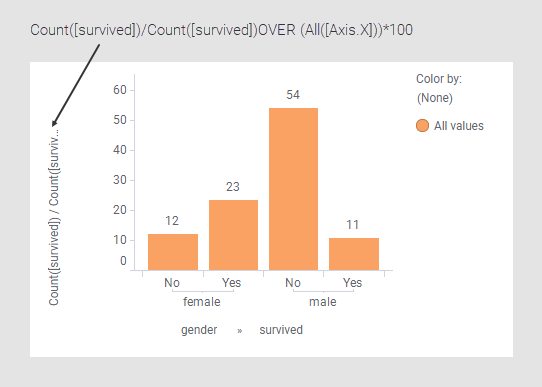
A recalculation of each marker (here each bar is a marker) is performed. For example, the second bar from the left shows that about 23% of the Titanic passengers were women who survived (307/(156+307+708+142).
In this example, the category axis is used for slicing. In the next example, the data is sliced using the color axis as well.
Example (the category axis and the color axis are used for slicing the data)
The bar chart below displays the same data as the bar chart at the top with the addition that the color axis is used to color the bars by gender.
When adding the same expression to the value axis as used above, note the difference:
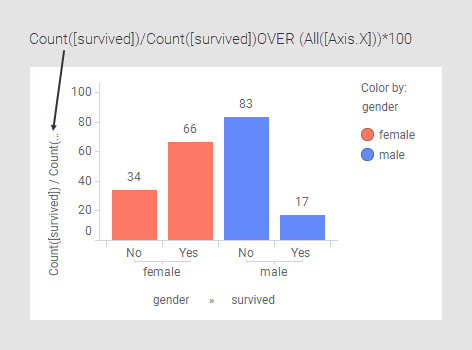
The percentages add up to 100% within each color instead.This is because the OVER All([Axis.X]) part of the expression declares that the slicing on the category axis should be ignored, but the slicing specified on the color axis is still taken into account. The effect is that the category axis slicing is certainly ignored, but within each of the colors.
For example, 66% of all females survived (307/(307+156).
Also note the difference when specifying the 'survived' column on the color axis:
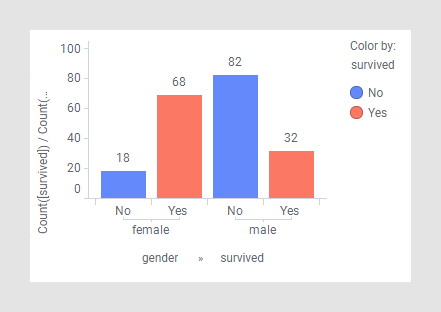
The same expression on the value axis gives another result. Here you can, for example, see that 68% of all survivors were women (307/(307+142)).