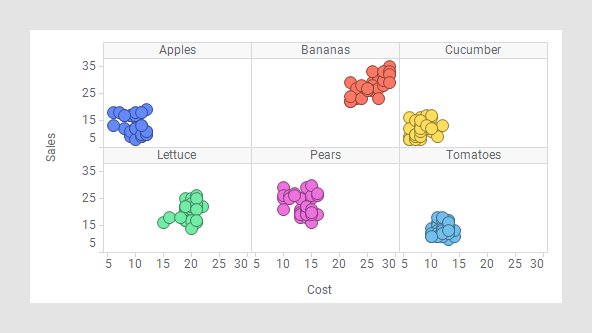
Scatter plot
In a scatter plot, markers are presented in a two-dimensional coordinate system. It is useful for getting an overview of how your data is distributed across two dimensions, and to spot correlations.
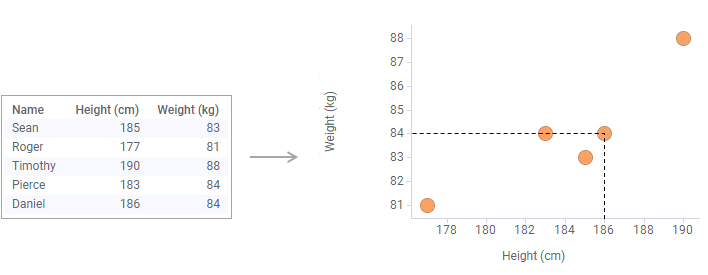
By default, each row in your loaded data table is represented by a marker. The marker's position in the coordinate system is defined by the row's values in the columns selected on the X-axis and the Y-axis. For example, the marker's position for the last row in the data table below is the coordinate 186 on the X-axis, and 84 on the Y-axis.
You can adjust the scales and scale labels, as well as other axis settings, from the visualization properties for each axis, and you can add features such as gridlines, zoom sliders or error bars, and so on.
More variables can be set to correspond to the color, size or shape of the markers, thereby adding more dimensions to the plot.
Correlation in a scatter plot
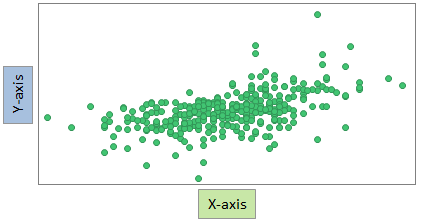
The relationship between two variables is called their correlation. If the markers are close to making a straight line in the scatter plot, the two variables have a high correlation. If the markers are equally distributed in the scatter plot, the correlation is low, or zero. However, even though a correlation might seem present, this might not always be the case. Both variables could be related to some third variable, which explains their variation, or, the distribution could be due to pure coincidence.

Aggregated markers
Labels
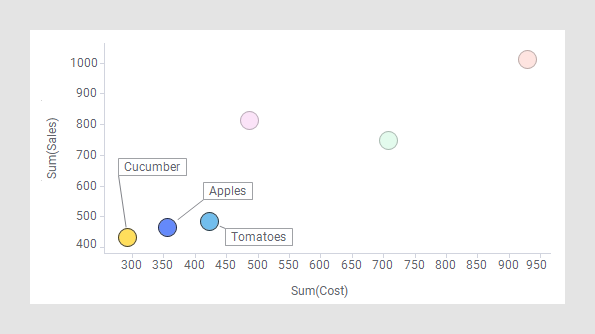
In a scatter plot, you can interact with the labels and move them by dragging them to a new position. If you move a label, it will stay in the new position until you reset the label positions from the right-click menu in the visualization (installed client only).
All visualizations can be configured to show data limited by one or more markings in other visualizations only (details visualizations). Scatter plots can also be limited by one or more filterings. Another alternative is to configure a scatter plot without any filtering at all. See Adding data limitations for a visualization for more information.
You can show data from multiple data tables in the same visualization if a proper data table matching is available. For more information, see Multiple data tables in one visualization and Column matches.
- Creating a scatter plot
In a scatter plot, markers are displayed in a two-dimensional coordinate system. It is useful for getting an overview of how your data is distributed across two dimensions. - Aggregating markers
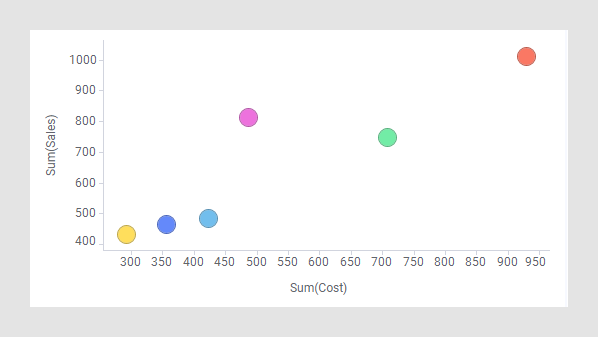
In a scatter plot or a 3d scatter plot (and sometimes also in a marker layer in a map chart), each row in the data is usually represented by a separate marker. However, by using the Marker by setting in the visualization properties, you can choose to aggregate the data into fewer markers, representing for example the sum or average of the values in each category instead. - Using marker appearance to add more information
The markers in a scatter plot provide an overview of how the data is distributed across two dimensions, the X-axis and the Y-axis. If you use colors, shapes, and sizes of the markers, further information about your data can be displayed. - Adding a connecting line between markers
You can add a connecting line between markers in a scatter plot, or in a marker layer of a map chart. You can specify in which order the markers should be connected, and arrows can be added to indicate a direction or movement. - Creating a density plot
The density plot shows how numerical data, binned into intervals, is distributed across the X-axis and Y-axis. To visualize the density, that is, visualize to which extent the markers overlap each other totally, the Color by setting is used. - Adjusting the drawing order of markers
When markers cover each other, partly or totally, it can be useful to specify an order in which the markers are drawn. Markers of certain interest can then be brought forward in the visualization, and other markers backward.
