Wide Data Variable Selector - Chi Square / Anova
From a very large data set (that is, one whose variables number in the thousands or millions), produces a new data set with correlations and significance statistics for each predictor (X) variable against a user-specified dependent (Y) variable.

Algorithm
The t statistic and corresponding p value calculations use the following formula.
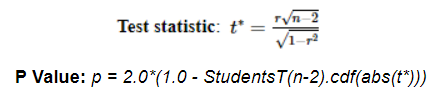
Scalability should not be limited by anything other than available cluster resources. The algorithm makes two passes through the data: one to collect the dependent values, and another to calculate the correlations.
Input
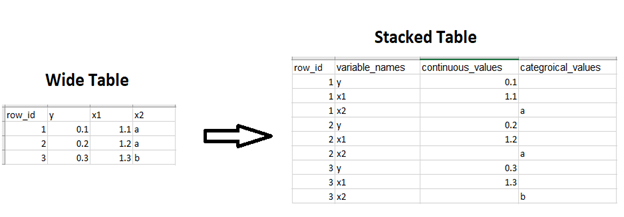
A single tabular data set that contains key-value pairs of variables and values in stacked format, with variable_names, continuous_values, and categorical_values, and row_id columns.
- Bad or Missing Data
- Missing data is not present in the input table. There is a minimum of two values for each predictor and dependent variable. Missing data is casewise deleted.
- Error and Exception Handling
-
The operation checks for validity of the dependent variable specification. See the Algorithm section for more information.
- If the dependent variable is categorical, then it should be in a categorical values column and have discrete values (string, long, int).
- If the dependent variable is continuous, then use the operator Wide Data Variable Selector - Correlations.
If there are not enough cases to calculate correlation for a variable (at least 2), then the operation returns NaN.
If there are not enough cases to calculate t statistic and p value (at least 3), then the operation returns 0 and 1, respectively.
Configuration
| Parameter | Description |
|---|---|
| Notes | Any notes or helpful information about this operator's parameter settings. When you enter content in the Notes field, a yellow asterisk is displayed on the operator. |
| Dependent Variable Name | The name of the dependent variable against which the correlation is computed. The dependent variable must be categorical. If is continuous, then use the operator
Wide Data Variable Selector - Correlations.
Required. |
| Variables Column | The name of the column containing variable names. The column should contain the Dependent Variable Name. |
| Continuous Values Column | The name of the column that contains the continuous predictor values. If the Dependent Variable Name is specified as continuous, then this value is required. |
| Categorical Values Column | The name of the column that contains the categorical predictor values. If the Dependent Variable Name is specified as categorical, then this value is required. |
| Row ID Column | The name of the column that contains the row ID numbers. Required. |
| Number of Bins | The number of bins used for the correlation. The default is 10. |
| Chi Square Output | Can be one of the following: |
| Output Directory | The location to store the output files. |
| Output Name | The name to contain the results. |
| Overwrite Output | Specifies whether to delete existing data at that path. |
| Storage Format | Select the format in which to store the results. The storage format is determined by your type of operator.
Typical formats are Avro, CSV, TSV, or Parquet. |
| Compression | Select the type of compression for the output.
Available Avro compression options. |
| Advanced Spark Settings Automatic Optimization |
|