Wide Data Variable Selector - Correlations
From a very large data set (that is, one whose variables number in the thousands or millions), produces a new data set with correlations and significance statistics for each predictor (X) variable against a user-specified dependent (Y) variable.

Algorithm
For each predictor (X) variable, the operator computes the correlation against the dependent (Y) variable. If categorical predictors exist, they are converted to continuous predictors using impact coding before the correlations are calculated. The algorithm does two passes through the data, one to collect the dependent values and another to calculate the correlations.
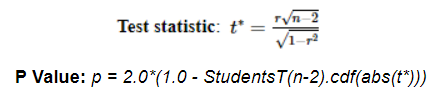
The t statistic and corresponding p value calculations use the following formula.
Scalability should not be limited by anything other than available cluster resources. The algorithm makes two passes through the data: one to collect the dependent values, and another to calculate the correlations.
Input
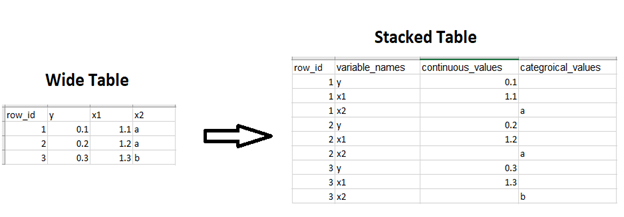
A single tabular data set that contains key-value pairs of variables and values in stacked format, with variable_names, continuous_values, and categorical_values, and row_id columns.
- Bad or Missing Data
- Missing data is not present in the input table. There is a minimum of two values for each predictor and dependent variable. Missing data is casewise deleted.
- Error and Exception Handling
-
The operation checks for validity of the dependent variable specification.
- If the dependent variable is continuous, then it should be in a continuous values column and have numeric values (double, float, long, int).
- If the dependent variable is categorical, then use the operator Wide Data Variable Selector - Chi Square / Anova.
If there are not enough cases to calculate correlation for a variable (at least 2), then the operation returns NaN.
If there are not enough cases to calculate t statistic and p value (at least 3), then the operation returns 0 and 1, respectively.
Configuration
| Parameter | Description |
|---|---|
| Notes | Any notes or helpful information about this operator's parameter settings. When you enter content in the Notes field, a yellow asterisk is displayed on the operator. |
| Dependent Variable Name | The name of the dependent variable against which the correlation is computed. Required. |
| Variables Column | The name of the column containing variable names. The column should contain Dependent Variable Name. |
| Continuous Values Column | The name of the column that contains the continuous predictor values. If the Dependent Variable Name is specified as continuous, then this value is required. |
| Categorical Values Column | The name of the column that contains the categorical predictor values. |
| Row ID Column | The name of the column that contains the row ID numbers. Required. |
| Number of Folds | The number of folds used in cross-validated impact coding. Range of 2 - 98. |
| Threshold for Grand Mean Replacement | An integer threshold below which the dependent's mean is used as an impact coding value. Range of 0 to the max integer value. |
| Random Seed | An integer value to use as the seed for random number generation when splitting the data into folds. Range of 0 to max integer value. |
| Correlation Computation | Specify the method to use to compute the correlation. Can be either Spark SQL (the default) or TDS. |
| Output Directory | The location to store the output files. |
| Output Name | The name to contain the results. |
| Overwrite Output | Specifies whether to delete existing data at that path. |
| Storage Format | Select the format in which to store the results. The storage format is determined by your type of operator.
Typical formats are Avro, CSV, TSV, or Parquet. |
| Compression | Select the type of compression for the output.
Available Avro compression options. |
| Advanced Spark Settings Automatic Optimization |
|