Filters are used to narrow down the selection of data shown in the visualizations. For example, a filter could be adjusted so that data is only shown for a certain range of dates or for a certain number of food products. When you manipulate a filter, you can instantly see how the current setting affects the visible data in the visualizations.
When you load data into Spotfire, each column in the data table is automatically represented by a filter. The initial type of filter depends on the type of data in the column, but you can right-click on any filter and change the type if you like.
You can view and manage filters in a popover, in a docked
panel, or as a floating window. See Panels
and Popovers for more information. Click on the Filters button on
the toolbar, ![]() , or select View > Filters to show or hide
Filters. The Filters panel or popover will open in the mode it was opened
the last time you had it open. The visibility of Filters is controlled
per page, and the Filters visibility of new pages is inherited from the
active page. The image below shows Filters as a docked panel with the
different filter types.
, or select View > Filters to show or hide
Filters. The Filters panel or popover will open in the mode it was opened
the last time you had it open. The visibility of Filters is controlled
per page, and the Filters visibility of new pages is inherited from the
active page. The image below shows Filters as a docked panel with the
different filter types.
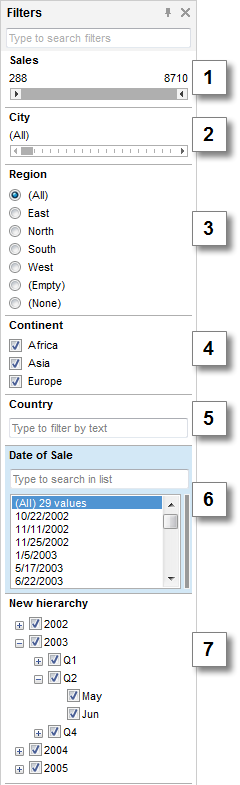
Number |
Filter Type |
1 |
Range Filter |
2 |
Item Filter |
3 |
Radio Button Filter |
4 |
Check Box Filter |
5 |
Text Filter |
6 |
List Box Filter |
7 |
Hierarchy Filter |
Note: Binary columns are not represented by filters.
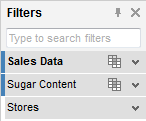
When more than one data table is available in the analysis, data table headers are automatically displayed above the filters. The active data table is indicated by bold typeface and a color stripe. Related data tables are indicated by stripes of the same color to the left of the filters, as seen in the image below.
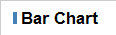
Visualizations also get a color stripe in the title bar, indicating which data table the visualization is based on, when more than one data table is available in the analysis. The image below shows a bar chart title bar with a blue color stripe indicating that the bar chart is based on the same data table as the filters in the image above.
Once a filter has been manipulated, you can right-click on it and select Reset Filter to return the filter to its original state (all values selected). Selecting Reset All Filters, either from the pop-up menu in the filters panel, on the toolbar, or from the Edit menu, returns all filters, visible or hidden, in the active filtering scheme to their original state. Note that resetting filters will only affect modifications related to filtering of the data. For example, if you have cleared any check boxes in a check box filter, or narrowed down the range of values in a range filter. Other changes, such as renaming a filter, changing the filter type or scale, will not be affected.
When Filters are in a popover or a docked panel, you can get a quick overview of which filters have been modified by hovering over the Filters heading:
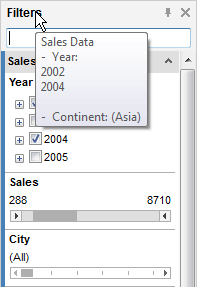
The filters currently modified are shown together with their settings in a tooltip.
See also: