What is a Cube?
An OLAP (Online Analytical Processing) cube is a multi-dimensional representation of data. When data is located in cubes it behaves rather different compared to data in the relational databases traditionally accessed via Spotfire. In relational databases, the facts are directly available in the database tables. In the cube, all facts are already aggregated by the cube administrator into predefined measures using specified combinations of hierarchies.
What are Facts?
Facts is a general name for measurements, metrics or facts which are of interest in the data analysis. In Spotfire this is generally what you would put on the value axis of a visualization (often a numeric column), and most of the times facts would be aggregated to show interesting values. For example, a fact could be the actual sum of money transferred at one specific sales transaction, the measured content of quicksilver in a sample at a specific date, etc. Facts are often aggregated together into larger bits of information, commonly referred to as measures. In cube analytics, a measure is always the aggregation of values from the fact column that you want to analyze; it is not a numeric column.
What is a Dimension?
Dimensions are commonly referred to categories in Spotfire. They represent the context for the interesting measures and determine how measures should be aggregated. For example, Country or City.
What is a Hierarchy?
Hierarchies are multilevel sets of dimensions. In cubes, a hierarchy can represent a single column, but it can also be represented by more than one column. Hierarchies composed of multiple dimension levels can be used to navigate from a wider perspective to a more narrow one both within Spotfire and in a cube. For example, a user hierarchy may go from Country to State to City to Postal Code, and so on.
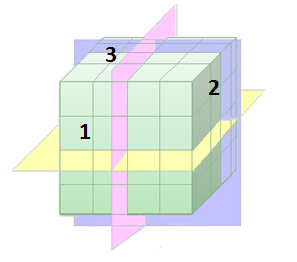
Cube Example
In the schematic image above, the sides of the cube could be said to represent different hierarchies.
As a simplification, if side 1 represents product type, side 2 is a time unit and 3 is region, then the cube could be queried in several different ways: the yellow plane could mean "Show sales per product for different years.", the pink plane represents "Show sales per product in different regions." and the blue plane "Show sales per region for different years.".
Predefined Queries
When a query is sent to the cube, it is common to ask for measures aggregated over a number of different hierarchies. For example, you may want to look at the sum of sales for all product types in all regions during the last three years. All combinations of measures and dimensions if interest should already be anticipated and set up in the cube by the cube administrator.
In a cube query, you always include all the hierarchies of the cube even if you do not specify them. That is the reason why cube queries are always aggregated. If no hierarchy is specified in a query, then the default is used. This is usually all possible items or the total of the value (for example, you would get the value for the whole country rather than split by cities). Theoretically, you could split a query enough to return the actual values from the underlying data warehouse, but the cube would still consider the query as aggregated.
In-database Cubes in Spotfire
Since cube data is already aggregated from the start, there is no need to do any aggregations when working with in-db cube data within Spotfire. Instead, Spotfire can be used as a way to display the related combinations of measures and hierarchies set up by the cube administrator. By taking advantage of the natural structure of the cube you can make sure that you are viewing relevant data. The free-dimensionality of Spotfire does otherwise allow you to make combinations of measures and dimensions from the cube that do not always make sense, or lead to "The expression is not valid"-messages in the visualizations.
Each time you change what is shown on the axes in a visualization based on in-db cube data, or make a selection in a hierarchy filter or a check box filter, a request is sent to the cube to provide the selected data. This means that if you make many changes in Spotfire, many requests may be sent to the database instead of just the request for the final selection.
Spotfire uses a delay of about one second in order to see if there are any additional selections made in a filter before sending the request to the database. This means that you should try to make coherent changes in filtering in a steady pace and not pause for too long while selecting various check boxes. If you pause for more than about a second, the current filter selection will be sent to the cube which will start to provide the requested data. Making additional changes to the filter will send an additional request to the database, causing a higher workload on the database, as the first request might still be running.
See also:
Working With Microsoft SQL Server Analysis Services
Working with Data from Oracle Essbase