When data is located in cubes it behaves rather different compared to data in the relational databases traditionally accessed via Spotfire. See Cubes in Spotfire for more information.
Dimensions and Dimension Attributes in Microsoft SQL Server Analysis Services
A dimension in this context is, for example, time, product, customer, region, etc. An attribute is a kind of categorization. For each dimension, you can be interested in a number of different dimension attributes. For example, the "Product" dimension may be investigated with regard to the attributes "Product.Color" or "Product.Model". The dimension can be the same on multiple sides of the cube as long as each side represents a different attribute, for example, Product.Color and Product.Model.
Measures
Connected to each set of dimension attributes are measures, or aggregated facts, such as sales figures, cost, sales volumes, etc. A measure is the aggregation of values from the fact column that you want to analyze; it is not a numeric column.
Note that a volume can be an attribute and not a measure in some cases; the volume of a container is a dimension attribute but the volume of delivery would be a measure.
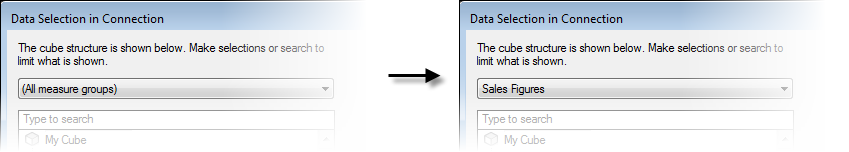
Measure groups are collections of facts that may come from different database tables. Spotfire allows you to select a single measure group in the Data Selection in Connection dialog, which can help you limit the data from the cube:
Note that if you select a dimension belonging to another measure group you will automatically also include that measure group in the selection and the measure group will also be visible in the Data Panel. (However, you will not get the measures from that measure group, only selected measures.)
Most of the times, you will probably only be interested in analyzing data from a single measure group, but there may be exceptions. It is important to know what you are doing if you are working with cube data in Spotfire. For example, if data is selected from two different, unrelated measure groups you might end up with a lot of empty columns in your data table.
Tip: It may be a better idea to add one data table per measure group into Spotfire and combine data from those data tables in one visualization using column matches, rather than trying to add a complete cube as a single, huge data table. Use the Data Selection in Connection dialog to select a single measure group when setting up the data connection.
Hierarchies
Hierarchies in Microsoft SQL Server Analysis Services are multilevel sets of dimension attributes. They can be of the following types:
Attribute hierarchies are hierarchies with one column. In the cube, they contain both the "All" member which represents the total of all the individual members plus the column with the individual members. Attribute hierarchies map to a single column in Spotfire.
User hierarchies are composed of different dimension attributes. They can be used to navigate from a wider perspective to a more narrow one within Spotfire. For example, a user hierarchy may go from Country to State to City to Postal Code, and so on. User hierarchies map to hierarchies in Spotfire.
Microsoft SQL Server Analysis Services Cubes in Spotfire
Normally, you would use measures on axes where actual values are to be displayed, such as, on the value axis of a bar chart, or as cell values in a cross table. Dimension columns, that is, attribute hierarchies and user hierarchies, can be used to split the viewed data into smaller subsets on categorical axes.
When looking at cube data in the data panel you have the possibility to select one measure group and one related dimension at a time, which may help you selecting suitable options on the axes. The whole cube is treated as a single data table in Spotfire when you analyze it in-database.
There are also other implications of working with cube data. Since the measures are defined by the context of a dimension, it is not possible to create filters for measures.
When importing cube data, all cube aggregations are lost. Hierarchies are imported down to the leaf level and measure values for that level are retrieved. See Importing Data from Cubes for more information.
Dynamic named sets are dynamic columns in the cube. For example, one set may show the Top 50 customers and this could either be displayed over different countries in the world or within a single country when using standard cube reporting tools. When you are working with dynamic named sets in Spotfire, the content of a dynamic named set column depends on the current context; the current limitations and filtering. Therefore, the axis expression must be evaluated after the current filtering is applied when dynamic sets are used in visualizations. This is a change from how axes traditionally are evaluated in Spotfire, but it is applied automatically when you are placing a dynamic named set column on an axis. See Details on Advanced Settings for more information about axis evaluation settings.
If you limit the selected data to male customers only and use a set showing Top 50, you will get the top 50 male customers. If limitations make the number of available male customers lower than 50 then this is the number you will end up with. All of these calculations are handled by the cube.
Spotfire only supports sets with a single output column.
Note: If you are going to import data from a Microsoft SQL Server Analysis Services cube, and named sets are included in the selection, the sets will be used to limit the data retrieved on import and to calculate the measures. For example, if the selection of data to import contains data from Germany and France, and a Top 50 customers set is used in the import, the Top 50 customers from Germany and France are imported. Filtering out Germany from the imported data may result in less than 50 values, since the set will now show only those customers that were imported from France. The same selection of data when working in-database will add the set as a dimension and the filtering will let you see the Top 50 values from France.
Known Limitations on Import
During import, sets are applied once. This means that selection of multiple sets with no intersecting data will result in a data table without any data.
PKI:s are not supported.
See also:
Working With Large Data Volumes