When you add data tables from a data connection, you have the option to either keep the data table external or to import it into the Spotfire data engine and use it in-memory.
Note: If you are interested in all of the data from an OLAP (Online Analytical Processing) cube, it is probably a better idea to use an in-database connection, while import is mainly intended for small subsections of the cube data.
When you are importing cube data into Spotfire you will actually flatten the cube into a single data table, which means that some features that you have access to when working with an in-database cube are lost and you may see different results when aggregating your imported data in Spotfire compared to what you get when the external system does all the aggregation. Spotfire does not import aggregated data, only leaf nodes that then can be aggregated using the Spotfire aggregation methods.
If you intend to import data from a cube into Spotfire there are a number of things that you must remember. First of all, the full cube may be enormous, so it is recommended to always limit the dimensions to import to those that are absolutely necessary only, to reduce data explosion as much as possible.
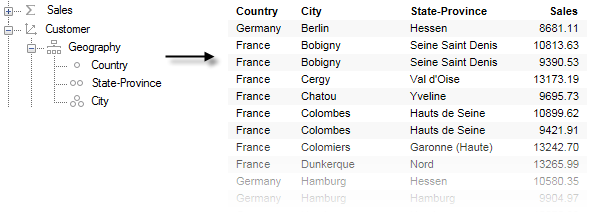
For example, if a cube like the one shown to the left below is imported into Spotfire, you will get the table shown to the right in the image below. The visualizations you set up will then decide how to aggregate the measures from the resulting table.
When an imported cube data table is aggregated (for example, with the default Sum aggregation), the available leaf values are simply summarized when you show a categorical value of a higher level (e.g. the Sum(Sales) for France from the table above). However, in the in-db cube, it is the external system that decides what an aggregation means, which may include other aggregation methods, data that was not included in the import, and so on, which may produce a completely different result.
Limit the Number of Dimensions
As an example of the importance of limiting the data as much as possible prior to import, imagine a cube with the following number of values for different dimensions:
Department: 10
Product: 5000
Currency: 20
Business Unit: 1000
Scenario: 10
Account: 100
Bringing in the entire cube would result in a cross-joined table with the following number of columns: 10x5000x20x1000x10x100=1x10¹²
As you can see, the amount of data very quickly explodes with the number of dimensions used, especially if each dimension contains many different values. Take care not to overload the data source by combining too many dimensions.
Best Practices
Limit the data to import as much as possible by selecting only the necessary dimensions and measures in the Data Selection in Connection dialog.
Limit data further by clearing check boxes for undesired categories in the selected data in the Limit Data dialog.
Click Estimate Import Size to try to evaluate whether an import is possible before you try to import a data selection.
Known Limitations
On-demand is not supported for cube data sources (neither for imported cubes nor for in-database cubes).
In contrast to data connections from relational data sources, selections for cube data connections always result in a single data table.
You cannot switch from an imported configuration to an in-database configuration in a cube data connection, the way you can with relational data sources, or vice versa. However, you can always replace a data table based on a cube data connection with another data table.
When cube hierarchies have been added to a connection, the hierarchies in Spotfire will not be updated when the data connection is edited. However, you can always recreate new hierarchies manually.
Import of large amounts of data may not work. If you try to import and it fails, edit the connection and limit the selected dimensions and/or categories some more.
The estimation of the expected import size is only an approximation and cannot give any definitive information regarding whether or not an import will work. If the estimation takes a long time it often, but not always, means that the result of the selection is too big to import.
If multiple instances of one leaf value exist you may get different behavior between imported data and in-db data, since the imported data may have lost hierarchical information required in order to distinguish the leaf values from each other. For example, there is more than one city called Berlin in the world and after an import, all of those cities will be clumped together into one group in the flattened data table, unless you make sure to always include full hierarchies on all axes.
You will always get the leaf nodes for those branches in the hierarchies you select. This means that you can only select full hierarchies, not single columns from a hierarchy.
To import data from a Microsoft SQL Server Analysis cube:
The TIBCO Spotfire Connectors product also includes connections to other cube data sources. Even though these steps use a Microsoft SQL Server Analysis cube they can be used as an example for import of any cube data since the process for adding data connections is quite similar for all cube sources.
Select File > Add Data Tables....
Response: The Add Data Tables dialog appears.
Click Add > Connection To > Microsoft SQL Server Analysis Services.
Response: The Microsoft SQL Server Analysis Services Connection dialog is opened.
Specify the Server you want to connect to.
Click Connect.
Response: Spotfire will connect to the specified server, and the cubes that are available on the server will be listed in the Cube drop-down list.
Select the Cube of interest.
Click OK.
Response: The Data Selection in Connection dialog appears.
If you want to limit your import to data from a single measure group, select the measure group of interest in the drop-down list.
Comment: You can also type any text in the search field to find objects containing that text only.
Click on the object of interest in the left pane, then click Add >.
Comment: See Icon Descriptions for information about what the different objects represent. If you select the cube icon, you will get all data in the cube. When it comes to hierarchies, you always have to add the entire hierarchy to the list, but you can use the Limit Data button to filter out higher levels of detail in the hierarchy from the actual selection at a later stage. You can repeat this step as many times you want to add more data to the selection.
Response: The selected data is added to the Data selection in connection list.
Dimension columns and hierarchies can be further limited by clicking on the selected column or hierarchy in the Data selection in connection list and then clicking on the button with a filter funnel and selecting Limit Data....
Response: The Limit Data dialog appears.
Clear the check boxes for categories that you want to remove from the selection.
Click OK to close the Limit Data dialog.
When you are done with your data selection it is recommended to click the Estimate Import Size button to get a hint on whether this selection will be possible to import or not.
Comment: The calculation may take a while. No measures are taken into account in the calculation, so if you have added many measures you may be unable to import the selection even if the estimated number of rows and columns is small. The estimated import size may be of help if an import should fail. Then, the next time you try to import data from that cube, you should try to make sure that the estimated size is smaller than the previous time.
When you are done with the data selection, click OK.
Response: The connection is added to the Data tables list in the Add Data Tables dialog.
Make sure the data table and not the connection is selected in the Data tables list and, under Load method, click Import data table.
Click OK in the Add Data Tables dialog.
Response: If the data selection was small enough, the data is imported.
Tip: Do all of the data selection work in a shared data connection and save it to the library instead of adding it to the analysis directly. This way you can reuse the work you have done later, or share your selections with others.
See also:
Adding Data Connections to an Analysis
How to Work with Data Connections and their Data Sources in the Library
Working With Microsoft SQL Server Analysis Services