To select subsets to compare:
In the Visualization Properties dialog, go to the Subsets page.
In the Select subsets to compare list, select the check boxes for the subsets you want to show in the visualization.
Comment: The subset named Current filtering is selected from the start, since showing the current filtering is the default behavior in visualizations.
In the Visualization Properties dialog, go to the Subsets page.
Select Add > Marking... to add a new subset.
Response: The Add Marking Subset dialog is opened.
If more than one marking exists in the analysis, select which one to base the subset on in the Marking drop-down list.
If you want the subset to show what is not in the selected marking, instead of what is in the marking, select the check box Use the complement of this subset.
Select whether or not it should be possible to mark and highlight items in the subset.
Specify a descriptive Display name for the subset. The display name will be used to identify the subset in the visualization. For example, in the legend or in trellis panels.
Click OK to close the dialog.
Response: The subset has now been added to the visualization.
Tip: You can specify how the visualization should handle empty subsets. See Empty Subsets to learn more.
In the Visualization Properties dialog, go to the Subsets page.
Select Add > Filtering Scheme... to add a new subset.
Response: The Add Filtering Scheme Subset dialog is opened.
If more than one filtering scheme exists in the analysis, select which one to base the subset on in the Filtering Scheme drop-down list.
If you want the subset to show what is not in the selected filtering scheme, instead of what is in the filtering scheme, select the check box Use the complement of this subset. This means that when you filter out data in the specified filtering scheme, then this subset will show the filtered out data.
Select whether or not it should be possible to mark and highlight items in the subset.
Specify a descriptive Display name for the subset. The display name will be used to identify the subset in the visualization. For example, in the legend or in trellis panels.
Click OK to close the dialog.
Response: The subset has now been added to the visualization.
Comment: You can specify how the visualization should handle empty subsets. See Empty Subsets to learn more.
In the Visualization Properties dialog, go to the Subsets page.
Select Add > Custom Expression... to add a new subset.
Response: The Add Custom Expression Subset dialog is opened.
Click on the Edit... button.
Response: The Custom Expression for Subset dialog is opened.
In the Expression field, specify the custom expression you want the subset to be based on.
When done, click OK.
Select whether or not it should be possible to mark and highlight items in the subset.
Specify a descriptive Display name for the subset. The display name will be used to identify the subset in the visualization. For example, in the legend or in trellis panels.
Click OK to close the dialog.
Response: The subset has now been added to the visualization.
The Complement of a Subset
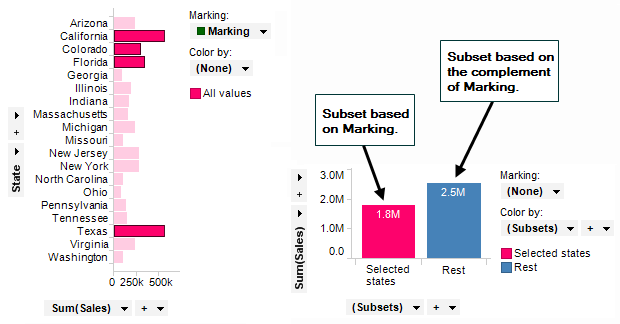
As mentioned above, when adding subsets based on a marking or a filtering scheme you can choose to use the complement of the marking or filtering scheme. This means that the subset will show what is not in the selected marking or filtering scheme, rather than what is in them. For example it might be useful to compare what is marked in a visualization to what is not marked in the same visualization.
Example:
The bar chart on the left-hand side below uses a marking named 'Marking', and the bar chart on the right-hand side is made up of two subsets based on that marking. The subset named 'Selected states' shows the aggregated value of the bars that are marked in the bar chart to the left. The subset named 'Rest' shows the aggregated value of all the bars that are not marked in the bar chart to the left; that is, the complement of the marking.
See also: