With subsets you can compare collections of your data within the same visualization. For example, you can compare all data to the current filtering, or the filtered data to the data that has been filtered out. Subsets are defined in the Subsets page of visualization properties, and can be added to all visualization types except the table. There are three subsets available by default on the Subsets page; All data, Current filtering, and Not in current filtering.
The All data subset will show all the data in the underlying data table. It can be a useful reference when you filter in the visualization, since the content of the All data subset will not change when you filter out data. The Current filtering subset will show the data that has not been filtered out using filters. This subset is automatically active from the start, since showing the current filtering is the default behavior in visualizations. The Not in current filtering subset will show the data that has been filtered out. You can also add subsets based on markings, filtering schemes and custom expressions.
Note: If the visualization is limited by markings or an expression, those limitations will be applied before the subsets are applied.
For example, if the visualization is set up as a details visualization (that is, data is limited by markings), then the All data subset should be interpreted as “all data that has been marked in the master visualizations”, and the Current filtering subset should be interpreted as the additional filtering made on the data that is marked in the master visualizations, and so on.
The All Data Subset
The example below shows a bar chart where the All data subset is used in combination with the Current filtering subset.
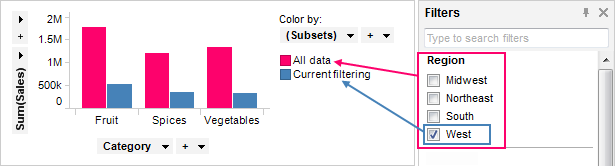
The blue bars represent the current filtering, and currently shows sum of sales for region West. When you filter the data in different ways, these bars will be updated as usual to reflect the filtering you do, while the pink bars representing all data will stay unchanged. This makes it possible to compare the filtered data to all the data at all times.
The Not in Current Filtering Subset
The example below shows a bar chart where the Not in current filtering subset is used in combination with Current filtering.
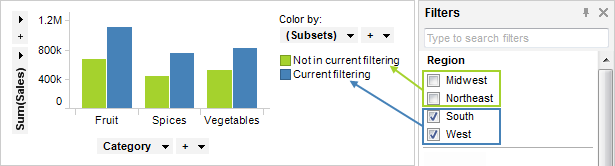
The blue bars represent the current filtering; in this case the South and West regions, which are selected in the check box filter. The green bars represent the filtered out data; the Midwest and Northeast regions, which are deselected in the check box filter.
Combining Subsets
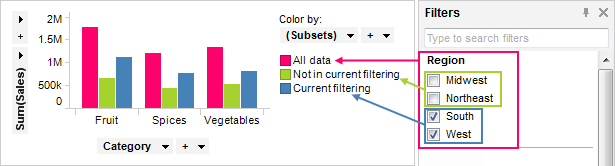
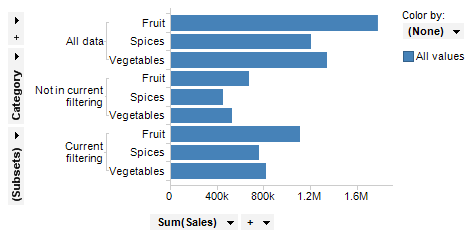
You can also combine all three subsets in a visualization. The bar chart below uses the All data subset, the Current filtering subset, and the Not in current filtering subset.
Selecting (Subsets) on a Grouping Axis
When you use subsets, the visualization needs to be grouped by the subsets in some way, otherwise the subsets cannot be compared. Therefore, the menu option (Subsets) is available on axes that can be used to group the visualization.
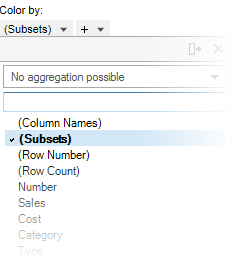
When you add a new subset to a visualization, (Subsets) will automatically be added to a grouping axis. In the examples above, it was added to the color axis, but it could also have been used on other axes, such as trellis by or on the category axis as in the examples below.
Trellis by (Subsets):
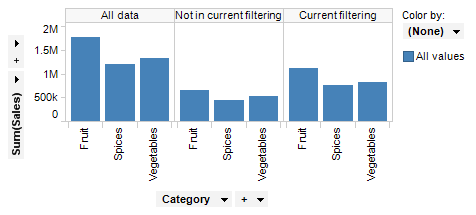
(Subsets) on category axis:
When the (Subsets) option is used on an axis, the underlying expression will be <[Axis.Subsets.Names]>. If the Subsets expression is to be used together with another categorical column or hierarchy, each of them must be separated with NEST or CROSS. For example, <[Axis.Subsets.Names] NEST [Category]>.
Deactivating Marking and Highlighting in Subsets
It can be useful to deactivate the marking and highlighting in subsets so that you can interact only with one of the subsets. This can be especially useful when you are using the All data subset in combination with another subset, like the Current filtering subset as in the example below.
To deactivate marking and highlighting in the All data subset:
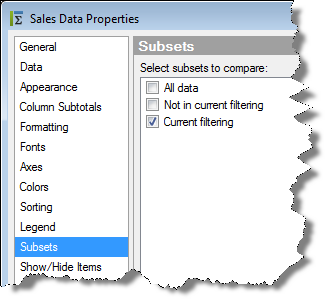
Open the Visualization Properties and go to the Subsets page.
Under Select subsets to compare, select the All data subset.
Click on the Edit... button.
Response: The Edit Subset dialog is opened.
Select the check box Deactivate highlighting/marking for this subset.
Click OK to close the dialog.
Response: From now on items in the All data subset will not become marked in the visualization.
Tip: Set the color of the All data subset to gray to indicate that the subset is used as a reference and that it will not respond to interaction.
Example:
The scatter plot below shows all the sales transactions that took place during four years. Each marker represents a buyer, and the markers are colored by the subsets All data and Current filtering. The current filtering shows the buyers from Arizona, as can be seen in the filters panel.
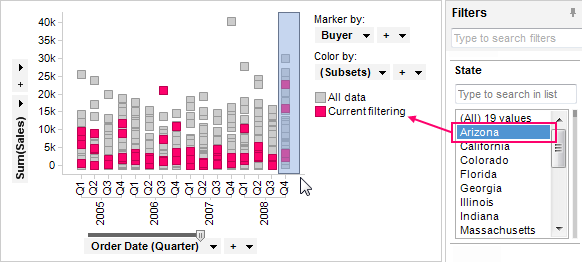
Perhaps you specifically want to take a closer look at the buyers involved in transactions during Q4 of 2008. Since marking and highlighting has been deactivated for the All data subset, it is easy to mark only those buyers in the current filtering.
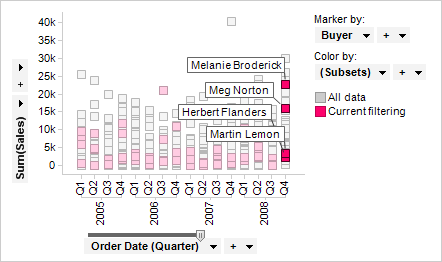
Only the markers in the current filtering becomes marked, and you can view further details for the four buyers represented by those markers, for instance in Details-on-Demand, or in a details visualization.
Subsets can sometimes be empty depending on the current configuration of the visualization. For example, if you are using a marking subset, but no data has been marked, or a filtering scheme subset, but no data has been filtered using that filtering scheme. You can decide how empty subsets should be handled in a visualization.
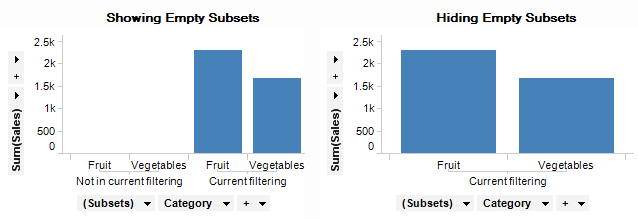
Example:
In the bar charts below, the Not in current filtering subset is used, but no data has been filtered out. This means that the Not in current filtering subset is empty. Depending on the axis category settings, you can choose whether to show or hide the category for empty subsets: The bar chart on the left-hand side shows the empty subset, the bar chart on the right-hand side, hides the empty subset.
To show or hide empty subsets:
The settings determining whether to show or hide empty subsets are always specified on the axis that is using (Subsets). For example, in the example above, this would be the category axis.
Open the Visualization Properties, and go to the page with the settings for the axis that is using (Subsets). In the example above, this is the Category Axis page in the Bar Chart Properties.
Click on the Settings... button to the right of the axis selector.
Response: The Advanced Settings dialog is opened.
In the Categories drop-down list, select Show all values, if you want to show empty subsets. Select Show filtered values if you want to hide empty subsets.
Click OK to close the dialog.
Response: Empty subsets are now shown or hidden depending on the choice you made.
Comment: You can also change this setting directly from the axis in the visualization by right-clicking in the axis and making your selection in the Categories submenu.
Note: If subsets turn up empty in a visualization combining data from multiple data tables, you may need to set up a relation between the data tables so that filtering in one data table affects filtering in others. Without a relation between the data tables, each data table is filtered on its own. For example, you may have set up a visualization with the Not in current filtering subset and you have filtered out data in the main data table. Then if you want to show a measure from a different data table, the data must be filtered out in both data tables in order to show up in the Not in current filtering subset. With a relation between the two data tables and using the Include Filtered Rows Only setting, filtering in one data table will be enough. See Filtering in Related Data Tables to learn more about how to change how filtering affects related data tables.
See also: