Option |
Description |
Show
color ranges |
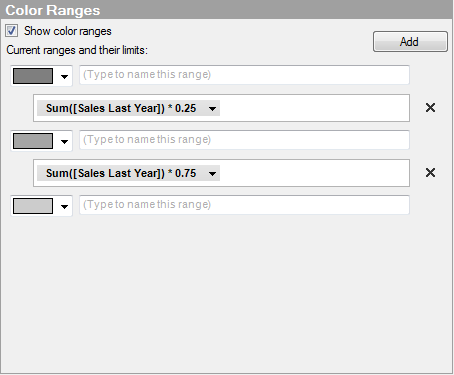
Select this check box if you want to display qualitative color ranges in the bullet graph. When the check box is selected, the controls in the lower part of the dialog becomes enabled. |
Add |
Click to add a new color range. Note: Before you have added any color ranges, the dialog will only show one color selector with a text field next to it because no limits have been defined yet. In the bullet graph visualization only one color will be displayed at this point, ranging from the lowest value on the scale to the highest value. As soon as you click the Add button, a column selector will appear below the color selector and the text field, and below the column selector another color selector with text field will appear. For each new color range you add, a new set of these three controls (column selector, color selector, and text field) are added below the last color range in the list. |
Current
ranges and their limits |
Lists all the currently added color ranges. |
[Color selector] |
Select a color to use for the color range. |
(Type to
name this range) |
Optionally, you can enter a name for the color range. The name of the color range can be displayed in the tooltip. |
[Column selector] |
Select a column, or enter an expression, that you want to use as the limit between the color range segments. Tip: If you want to use a specific value or percentage, see below. Note: The first color range in the list of Current ranges and their limits will automatically start from the lowest value on the bullet graph scale and range to the first limit. And likewise, the last color range in the list will automatically range to the highest value on the scale. |
[Remove button] |
Click to remove a color range. Note: This will remove the column selector to the left of the button from the dialog, as well as the color selector and text field directly below the column selector. |
Tips for common setups of color ranges
Color ranges showing specific values:
You can set the limit between two color ranges to a specific value if you do not want it to be calculated from a column. For example, if you want to use the value 1500, just open the Custom Expression dialog by right-clicking on the column selector representing the limit you want to set, then enter 1500 in the Expression field, and click OK to close the dialog. The value will be displayed in the column selector, and be used as the limit between the two color ranges.
Color ranges showing percentage:
You can also set up the color ranges to represent percentage. Perhaps you have a bullet graph showing this year's total sales compared to a target value, and you want to compare these two values with sales last year, by setting up the color ranges to show percentage of last year's sales as seen below:
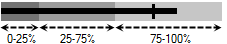
To achieve this, set up the bullet graph with three color ranges as described in How to Use Bullet Graphs. For the limit between the first and the second color range, open the Custom Expression dialog and enter the expression Sum([Sales Last Year]) * 0.25. And for the limit between the second and the third color range, enter the expression Sum([Sales Last Year]) * 0.75. Click OK to close the dialog. The expression will now be displayed in the column selector, and the limits between the color ranges will use the specified percentage.
See also:
How to Use the Graphical Table

