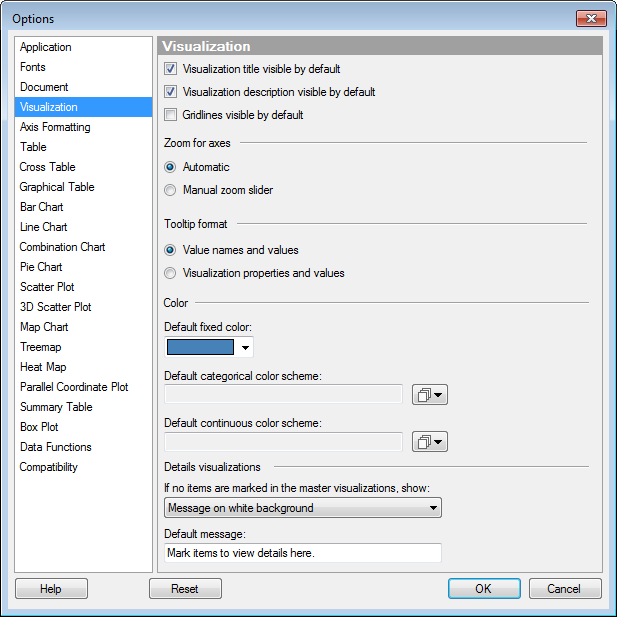
These settings take effect when creating a new visualization.
Option |
Description |
Visualization
title visible by default |
Select whether or not the title bar for new visualizations should be visible by default. |
Visualization
description visible by default |
Select whether or not the description for new visualizations should be visible by default. |
Gridlines visible
by default |
Select whether or not gridlines should be visible in new visualizations (where applicable) by default. |
Zoom for axes |
Select whether zooming should be automatic or require the use of manual zoom sliders, when creating a new visualization. |
Tooltip format |
Select whether the tooltip should show "Value names and values" or "Visualization properties and values". Generally speaking, the first option means that the tooltip will show the column names and corresponding values for the highlighted row. The second option means that the tooltip will show the name of the properties (rather than the corresponding columns) and the values. Example "Value names and values": Product: Bananas Month: March Sales: 3300 Example "Visualization properties and values": Color: Bananas X: March Y: 3300 |
Default
fixed color |
Select which color should be used as the fixed color in all visualizations. |
Default
categorical color scheme |
Select which scheme should be the default categorical color scheme for all visualizations. If the color scheme is categorical, only the colors from the color scheme will be used in the visualizations. No values will be matched between the color scheme and the visualizations. And if the selected color scheme contains any rules, they will not be included. Note: Changing the default color scheme will not affect any already existing visualizations. The new default scheme will only be used in visualizations created after the change. |
Default
continuous color scheme |
Select which scheme should be the default continuous color scheme for all visualizations. If the color scheme is categorical, only the colors from the color scheme will be used in the visualizations. No values will be matched between the color scheme and the visualizations. And if the selected color scheme contains any rules, they will not be included. Note: Changing the default color scheme will not affect any already existing visualizations. The new default scheme will only be used in visualizations created after the change. |
Details
visualizations |
Settings for specifying the default behavior when using details visualizations where the marking in one or more master visualizations decides what will be shown. See What is a Details Visualization? to learn more about using details visualizations to drill down into your data. |
If
no items are marked in the master visualizations, show |
Select what details visualizations should show when no items have been marked in their master visualizations. Comment: Since different visualization types have different available attributes, it varies between visualization types exactly what will be shown using the available alternatives. For example, some visualizations do not display axis selectors, and others do not display scales. The help section for the Data page of the Visualization Properties describes the specifics for each visualization type. |
All
data |
Use this option if you want details visualizations to show all the data from the master visualization that controls the content, if no items have been marked in that visualization. |
Empty
visualization |
Use this option if you want details visualizations to display only the scales and axis selectors, where applicable, if no items have been marked in the master visualization. |
Message
on white background |
Use this option if you want details visualizations to display a message if no items have been marked in the master visualization. The axis selectors will also be visible, where applicable. For example, you may want to write a text letting anyone using the analysis know which visualization is the master visualization that controls the content of this visualization. |
Default
message |
Specify a message to be displayed by default in details visualizations if no items are marked in the master visualizations. |
Reset |
Resets all properties on this page to the default values. Note that an administrator can configure which settings should be default for certain user groups on the server. If you are a member of such a group, the options on this page will be set to these defaults when you press the Reset button. |
See also: