Example 1: A simple project for creating standard reports and summaries
Overview
The purpose of this example is to illustrate basic operations in the Statistica workspace such as setting up summary reports, tables, and graphs [see also Exploratory Data Analysis (EDA)].
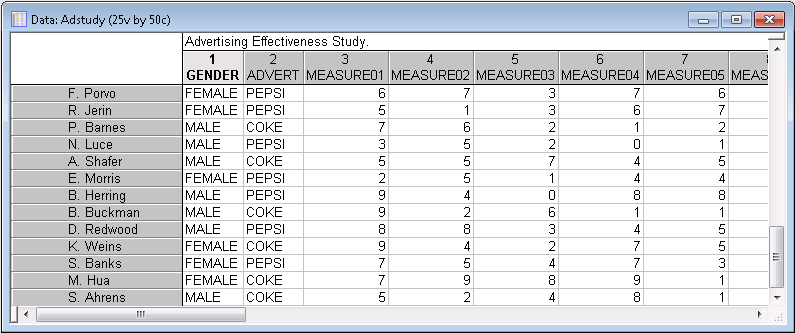
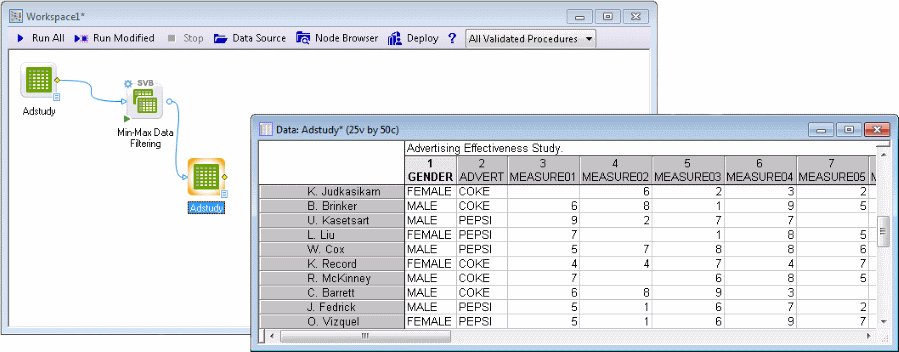
This example is based on the example data file Adstudy.sta. Suppose the data file contains the names (in the case name column of the data file) of purchasing managers at different large restaurant chains. The column Gender identifies the gender of the purchasing managers, Advert identifies whether they are serving Coke or Pepsi in their restaurants, and variables Measure01 through Measure23 contain information related to recent (23 months of) purchases made from your company (where 0=None). A portion of the Adstudy.sta data file is shown below.
We want to set up a data mining project that enables us to identify quickly those purchasing managers who have bought the most from you, separated into Coke and Pepsi (serving) restaurants.
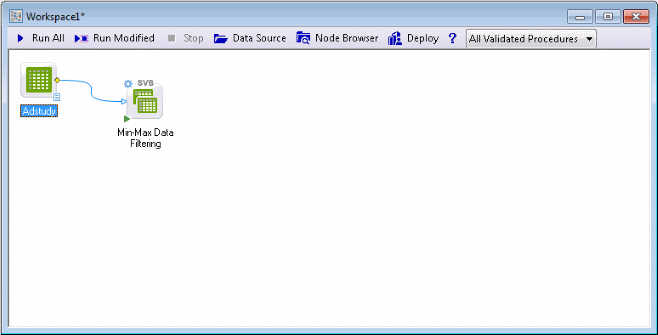
A blank Statistica workspace and the Select Data Source dialog box are displayed. The Adstudy.sta data file displays in the Select Data Source list because the data file was opened before the workspace was opened.
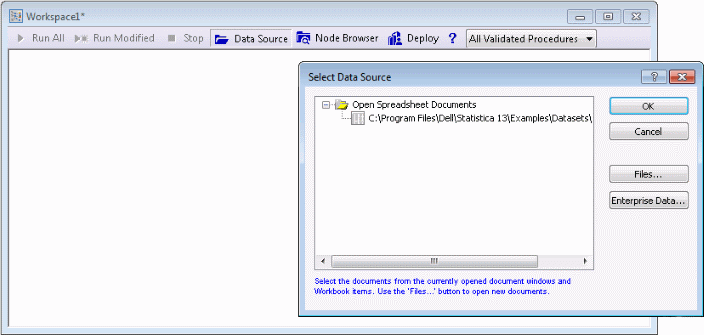
If the data file had not been opened before the workspace was opened, Click the Files button, and browse to and open the desired data file (in standard installations, example data files are located in C/Program Files/Statistica /Statistica */Examples/Datasets).
Select the Adstudy.sta data file in the list, and click OK to insert the data source node into the workspace.
Continuous vs. categorical variables; dependent vs. predictor variables
Statistica Data Miner classifies variables as either categorical (e.g., Gender) or continuous (e.g., Height, Weight), and as dependent or output variables and independent or predictor variables. The latter distinction is really only meaningful in the context of predictive data mining when the purpose of the project is to forecast or predict observations. This example is primarily concerned with identifying certain people (purchasing managers) based on data management operations, and to compute meaningful summary reports and statistics that enable us to identify quickly the most promising prospects in our client database. In general, for data mining nodes that compute descriptive statistics or graphs, you can specify the variables of interest as either predictor variables or dependent variables, and the statistics will be computed for the variables in either list.
Data Cleaning and Filtering
The first step in almost all data mining projects is to first ensure the integrity of the data, i.e., to identify miscoded data values, invalid ranges, etc. In Statistica Data Miner, you could do this interactively by using the various data management tools available for data spreadsheets. However, most data mining projects are set up to be used repetitively on the same or similar input data (e.g., suppose the database of clients/purchasing managers is updated weekly), and in this case it is preferable to set up nodes in the data mining project workspace that perform the required data verification and cleaning.
In this example, we want to first eliminate all 0s from measures 1 through 23 so that we can compute averages (of the number of purchases made) based on only those months with values (number of purchases) greater than 0. We will do this by first replacing all values less than 1 in these variables with missing data.
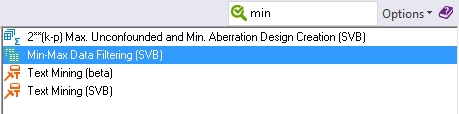
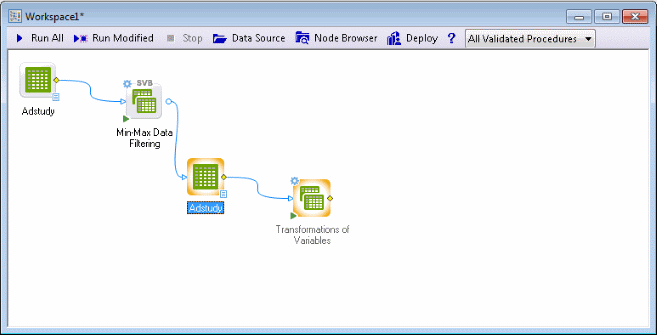
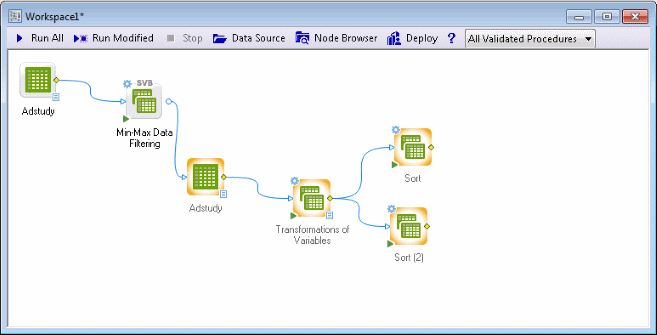
Ensure that the Adstudy data source node is selected. In the Feature Finder in the upper-right corner of the application, type min and in the list that is displayed, select Min-Max Data Filtering (SVB) to insert that node into the workspace.
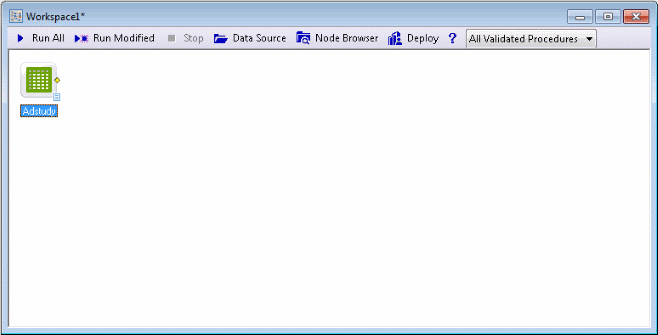
The node is automatically attached to the data source node.
If the data source node had not been selected before inserting the Min-Max Data Filtering node, the two nodes will not be automatically connected.
To connect nodes, select the yellow diamond icon on the right-center of one node and drag to another node.
Double-click the Adstudy data source node to display the Select dependent variables and predictors dialog box.
Click the Variables button, and in the variable selection dialog box, select Measure01 through Measure23 as Dependent; continuous variables. Select Gender and Advert as Dependent; categorical variables.
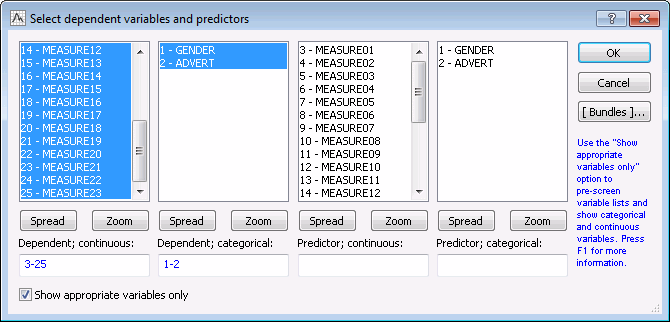
Click the OK button.
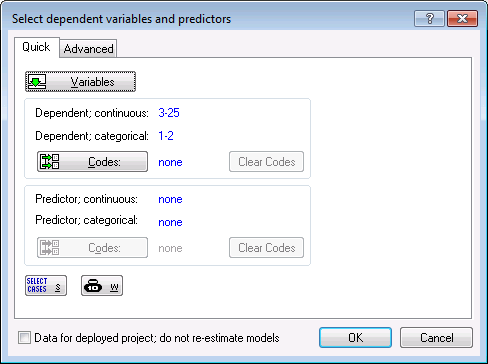
Click OK in the Select dependent variables and predictors dialog box.
Double-click the Min-Max Data Filtering node to display the Min-Max Data Filtering dialog box, which contains options to define the parameters for the Min-Max filtering. You can specify the Type of filtering as well as valid Min and Max ranges for each variable list (continuous dependent, categorical dependent, continuous predictors, categorical predictors). For this example, we want to replace 0s with missing data for Measure01 through Measure23 (previously selected as dependent, continuous variables) with missing data.
In the Type of filtering drop-down list, select Replace with MD.
In the Dependent; Continuous Min. field, type 1.
In the Dependent; Continuous Max. field, type 9.
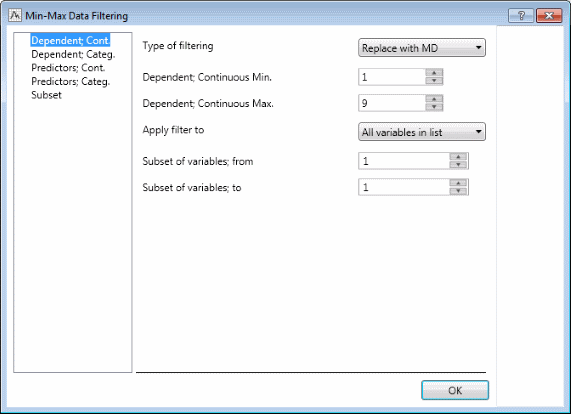
Since the values in Measure01 through Measure23 are all in the range from 0 through 9, by setting the Min and Max values to 1 and 9, respectively, you are effectively transforming all values of 0 (or less), or 10 (or greater) to missing data.
Click OK to close this dialog box.
Click Run All on the workspace toolbar to apply this node to the input data. A new spreadsheet is generated; you can review the values in that spreadsheet by right-clicking it and selecting View Document from the shortcut menu.
As intended, all 0s were removed from the input data file and replaced with missing data values.
Transforming the Data
Next, compute the average number of purchases for the last three and six months recorded in the data file, i.e., the average of variables Measure21 (variable 23) through Measure23 (variable 25), and Measure18 (variable 20) through Measure23 (variable 25), respectively.
Select the new data node, select the Data tab, and in the Transformations group, click Transforms.
The Transformations of Variables node is inserted into the workspace.
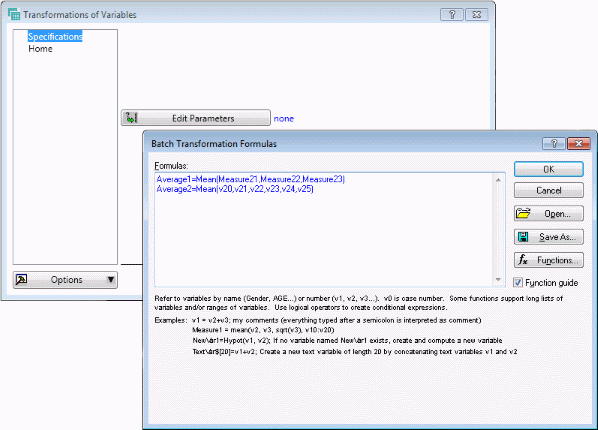
Double-click the node to display the Transformations of Variables dialog box.
Add two variables to the data file, Average1 and Average2, and then specify the two transformations.
To do this, click the Edit Parameters button to display the Batch Transformation Formulas dialog box. In the Formulas field, type in the formulas:
Average1=Mean(Measure21,Measure22,Measure23)
Average2=Mean(v20,v21,v22,v23,v24,v25)
You can use either the variable names or the variable numbers to reference variables. The general syntax for specifying transformations is identical to that for all spreadsheet transformations. (Note that if you are working on a computer that is set up for a non-English language, you need to use the respective field and decimal separators for your language, e.g., semicolons instead of commas, etc.)
Click OK to close the Batch Transformation Formulas dialog box. A message is displayed to confirm adding two variables. Click Yes. A message is displayed to inform that the formulas are OK. Click Yes to proceed.
Click OK to close the Transformations of Variables dialog box.
Run the project; note that you can also right-click on the Transformations of Variables node, and select Run to Node from the shortcut menu (or press F5) if you don't want to update the entire project, but only the respective nodes leading to the currently highlighted node.
Click the paper icon on the lower-right corner of the Transformations of Variables node to view the data.
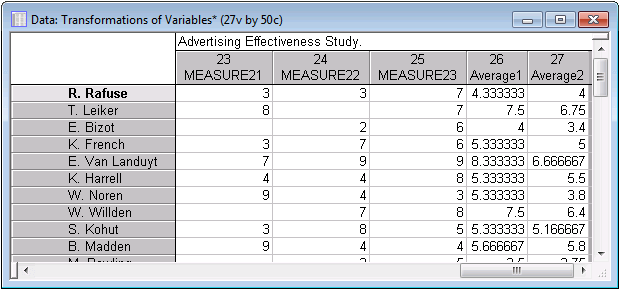
As intended, two new variables were created with the averages we specified.
Sorting the data
Now we will sort the data by the two variables we created, i.e., by the two indicators of the average number of sales in the last three and six months, respectively.
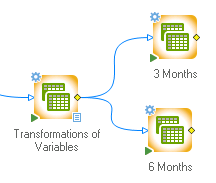
Select the Transformation of Variables node.
On the Data tab, in the Cases group, click Sort two times in order to insert two Sort nodes into the workspace.
We want to create two data files: one sorted by variable Average1 (average number of purchases in the last three months) and another by variable Average2 (average number of purchases in the last six months).
Double-click the first Sort node. In the Sort dialog box, click the Edit Parameters button.
In the Variables list, scroll down and select Average1. Click the Add Vars button. In the Direction group box, select the Descending option button.
Click OK in the Sort Options dialog box. Click OK in the Sort dialog box.
Repeat these steps with the second Sort node, but in the Variables list, select Average2.
Run the two Sort nodes.
Rename the nodes to assign more meaningful labels: right-click the first Sort node, select Rename from the shortcut menu, type 3 Months, and click OK.
Repeat these steps for the second sort node, but type 6 Months.
You could now use the sorted data files to start calling on the purchasing managers. You will find your biggest customers at the top of the list.
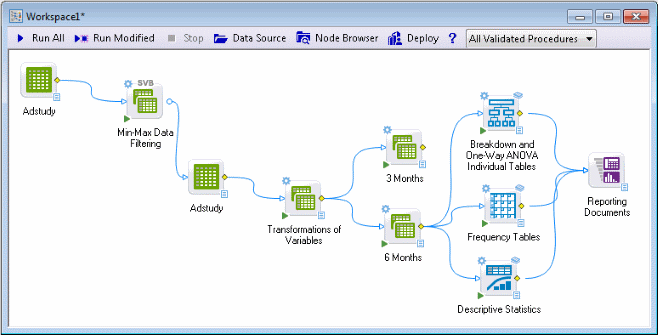
Connecting statistical analyses
Next, we will connect some descriptive statistical analyses and graphs to these data files. Suppose we are interested in computing the average number of purchases made over the last 3 months and 6 months for all observations in the input file (for all purchasing managers), and also want to compute these means broken down by variable Advert (Coke vs. Pepsi).
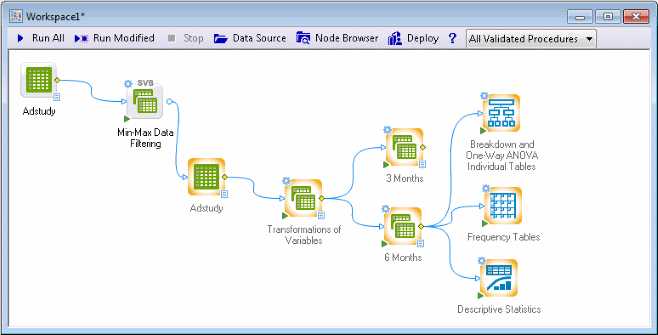
Select one of the new spreadsheets generated by the Sort nodes, e.g., 6 Months (they both contain the same information, only sorted in different ways).
On the workspace toolbar, click Node Browser. The Basic Statistics folder should be selected by default. If it is not, expand the Statistics folder, expand the Base folder, and select the Basic Statistics folder.
In the right pane, select Descriptive Statistics, Breakdown and One-Way ANOVA Individual Tables, and Frequency Tables.
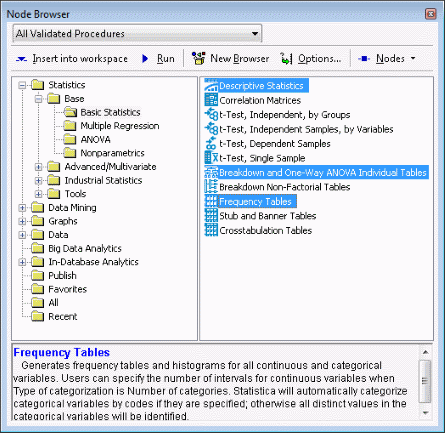
Click Insert into workspace. Close the Node Browser.
Double-click the Breakdown and One-Way ANVOVA Individual Tables node.
- In the dialog box, click the Variables button.
- In the variable selection dialog box, select the Show appropriate variables only check box
- In the Dependent variables list, select Average1 and Average2. In the Grouping variables list, select Advert. Click OK.
- On the Results - ANOVA & test tab, select the Analysis of Variance check box and the Levene tests check box.
- Select the Interaction plots check box, and when the variable selection dialog box is displayed, select Average1 and Average2. Click OK.
- On the Downstream tab, from the drop-down list, select Breakdown Descriptives.
- Click OK to close the dialog box.
Double-click the Frequency Tables node.
- Click the Variables button and select Advert, Average1, and Average2, and click OK.
- On the Downstream tab, from the drop-down list, select Summary Descriptives.
- Click OK to close the dialog box.
Double-click the Descriptive Statistics dialog box.
- Select the same three variables (clear the Show appropriate variables only check box in the variable selection dialog box, and when the message is displayed, click Continue with current selection).
- On the Results - Quick tab, select the Frequency tables check box and the Histograms check box.
- On the Downstream tab, from the drop-down list, select Summary Descriptives.
- Click OK to close the dialog box.
Run the workspace.
The requested analyses automatically generate a number of results spreadsheets and graphs in the results workbook (Reporting Documents node). Also, by making the selection on the Downstream tab, the nodes generate data sources for subsequent analyses (click the paper icon on the lower-right corner of the node to view these). In many cases, those data sources are the most relevant (important) results spreadsheets for the requested analyses, to which you may want to connect additional graphics nodes, etc.
The final project
The results generated by the analyses we have specified contain a wealth of information, graphs, tables, etc. For example, the Breakdown... node computed plots of means with standard errors for the two variables Average1 and Average2, broken down by variable Advert.
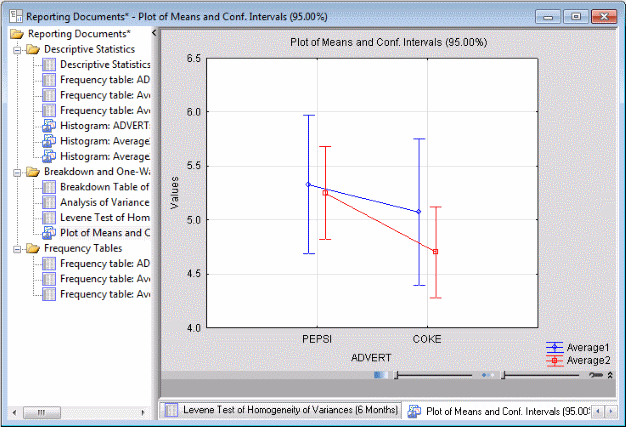
For example, restaurant chains that sell Pepsi generally have made more purchases over the past three months as well as the past six months. Frequency tables for the average numbers of purchases are also computed, and so on.
You can now save the data miner project to a file (file name extension .sdm) for application to other data or updated data in the future. When you save the project, all nodes, variable selections, and selections of options for various nodes will automatically be saved along with the overall arrangement of analyses (nodes).
Summary
This simple example demonstrates the stages of data mining (see also Crucial Concepts in Data Mining): How to connect data and select variables, how to verify the input data (i.e., how to perform data cleaning), and how to analyze the data. By flexibly combining the functionality of the large number of analytic and data management procedures available in Statistica along with advanced data access options (such as the Streaming Database Connector technology), the possibilities for creating custom analyses are practically limitless.
See also, Data Mining Definition, Data Mining with Statistica Data Miner, Structure and User Interface of Statistica Data Miner, Statistica Data Miner Summary, and Getting Started with Statistica Data Miner.