
Performance Tab
This tab helps us understand how the model(s) in a scoring pipeline are performing.
Contents
Overview
The TIBCO ModelOps environment captures two types of real-time metrics, technical and model quality, during the execution of all services. These metrics are reported by the TIBCO ModelOps components as they execute. They are collected by a Metrics Store provided by Prometheus, which is installed in the TIBCO ModelOps cloud infrastructure. LiveView monitors the Metrics Store in real-time and aggregates the raw metric values to provide support for a rich visualization of a subset of the metrics on the ModelOps UI.
Model Types and Metrics
Metrics are summarized as per the below table for different model types:
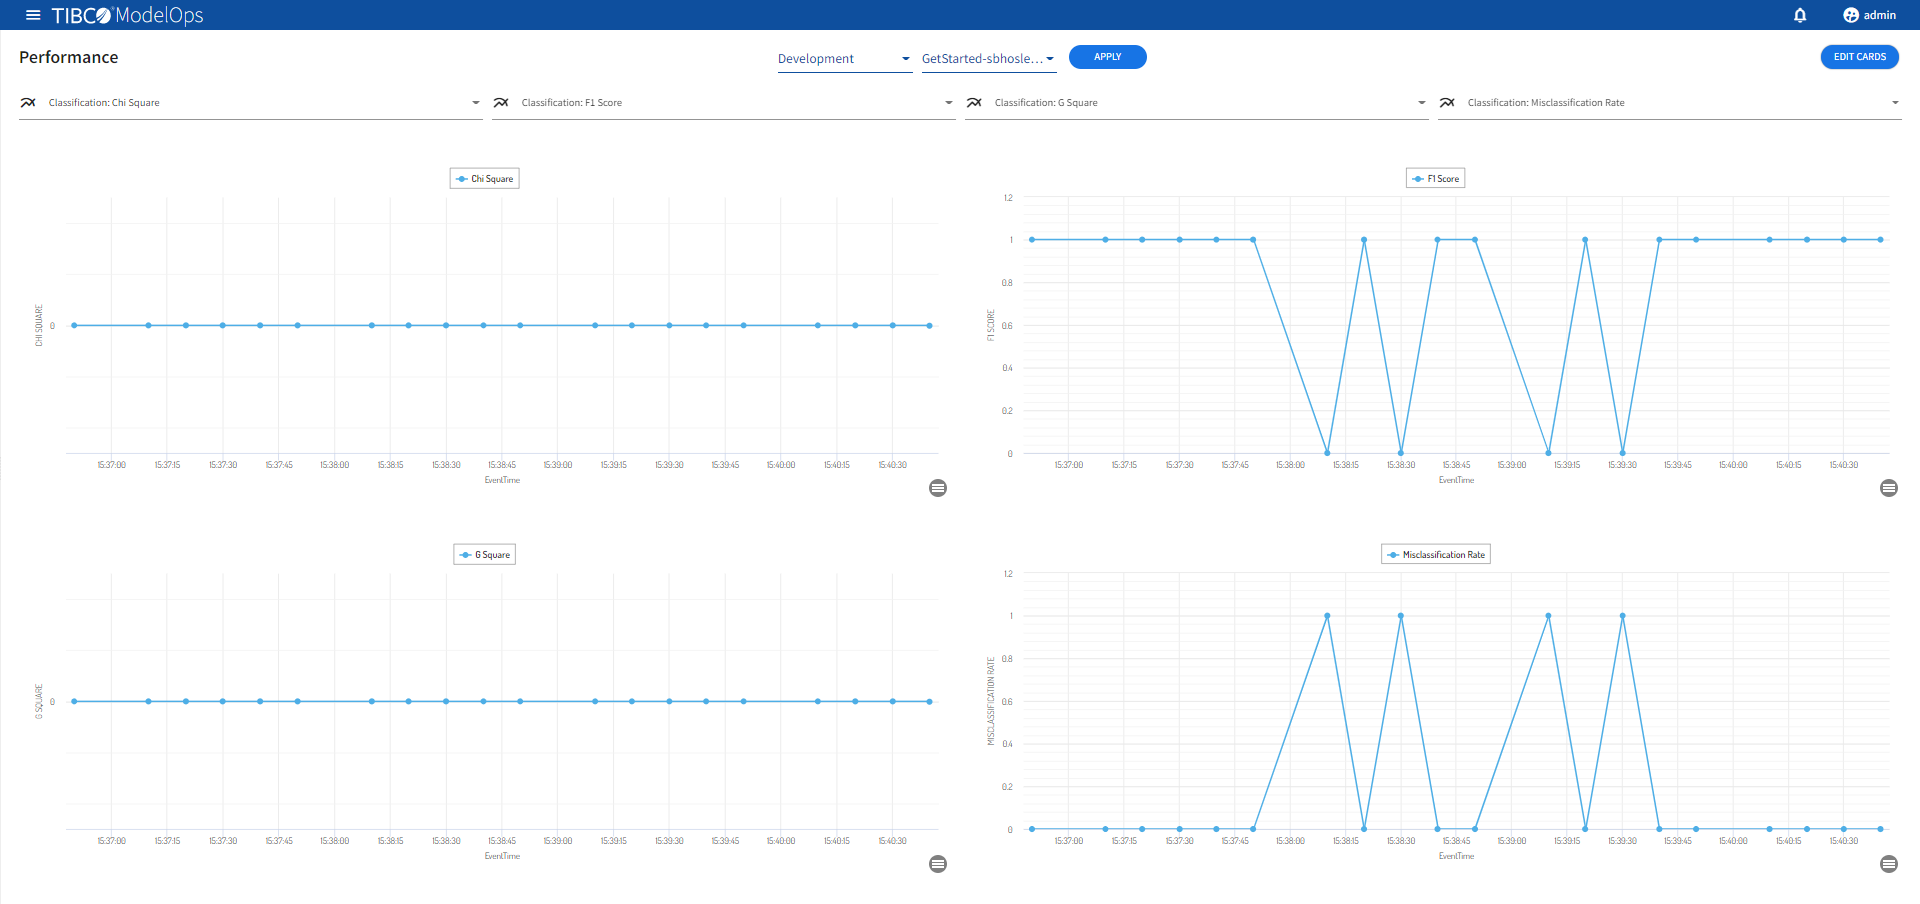
Before selecting the metrics, make sure you enter proper environment and pipeline for deployment. Click Apply after you have entered the details. You can select 4 metric cards at a time to see the performance. Each card is represented using a line graph. At the bottom of each card, you can find a menu icon.
Clicking the menu icon offers the following options:
- Ability to pause and resume the LiveVIew Web card
- Refresh the LiveVIew Web card
- Search and select different LiveVIew Web cards