Compound Annual Growth Rate
The Compound Annual Growth Rate, CAGR, expression shortcut calculates the smoothed annual growth rate over a given time period.
To compare two investments, you can calculate the growth rates during a time period, for example, for measures such as revenue, production level, or number of registered users.
The formula used is
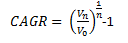
where
 means the ending value,
 the starting value, and
 the number of years in the
time period.
the number of years in the
time period.
Example
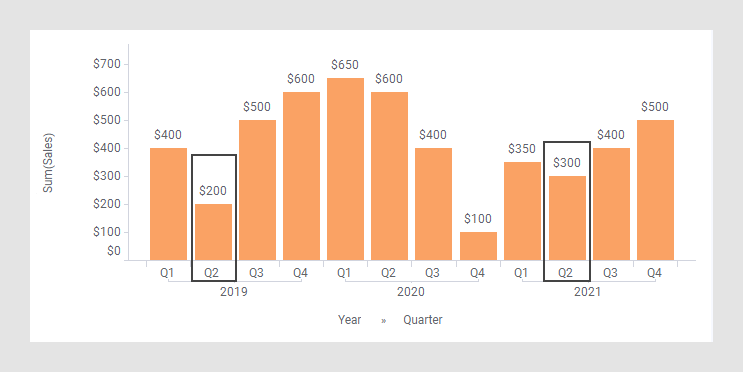
As starting point, the bar chart below is used. It shows the quarterly sums of sales for three years.

In the next bar chart, the shortcut expression Compound Annual Growth Rate has been applied on the Value axis.
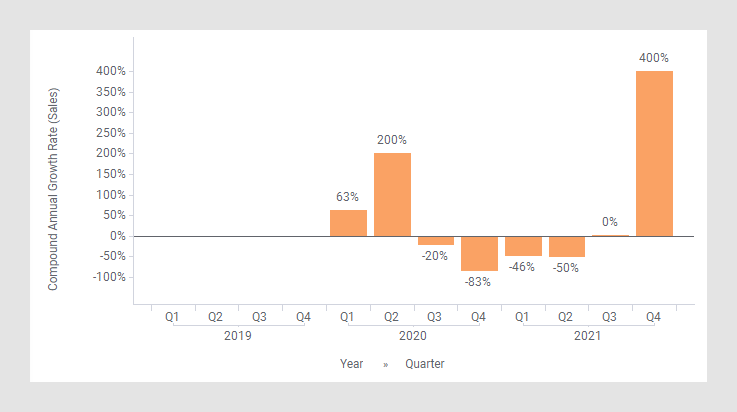
The following expression is used on the Value axis.
Sum([Sales]) THEN (Real([Value]/Sum([Value]) OVER
		(NavigatePeriod([Axis.X],"Year",-1)))^ (1/([X.Year] - First([X.Year])OVER
		(NavigatePeriod([Axis.X],"Year",-1)))))-1
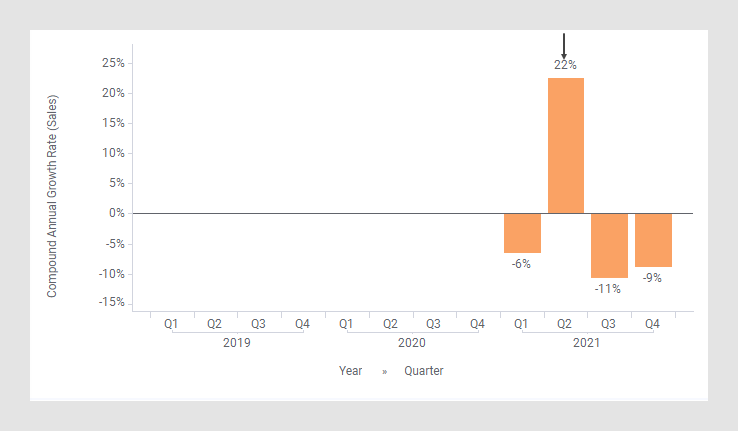
This default expression calculates the growth rate from one year to the next year, ad not the rate over a number of years. To instead calculate the annual growth over, for example, two years, use the expression
Sum([Sales]) THEN (Real([Value]/Sum([Value]) OVER
		(NavigatePeriod([Axis.X],"Year",-2)))^ (1/([X.Year] - First([X.Year])OVER
		(NavigatePeriod([Axis.X],"Year",-2)))))-1
This expression shows the growth rate, if the growth rate would be just as much each of the two years. The bar chart would change to the appearance below. (The arrow points to a bar used to explain what is calculated in the expression further down.)
The first part of the expression specifies that the column [Sales] should be aggregated as a sum. The result of this part goes into the [Value] column to be used in the expression following THEN.
After THEN comes first a conversion to the data type Real to make sure that ^ (the power function) will work for all column types, for example, Currency.
Each node is then divided by the corresponding node two years earlier, and this ratio is in turn raised to ½. (½ is because the number of years is two. When the number of years is three, the ratio is raised to ⅓.) Then the result is subtracted by 1 to get the percentage.
The aggregation First() is just used because an aggregation is required before the OVER keyword. It will take you to the first value of the node to subtract, but since each node only has one value, this corresponds to picking the value of the node.
For example, the calculation of the Compound Annual Growth Rate for Q2, 2021:
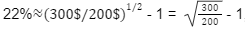
This means that the smooth annual growth rate is 22%, that is, after
two years, the amount is 200*1.22*1.22 300.
300.
(See the rectangles below.)
See also NavigatePeriod().
The column selector in expanded mode
In the installed client, the extended column selector offers controls that make it easy to change various parameters in the expression shortcut:
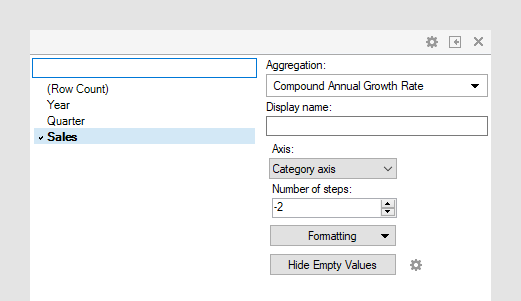
| Display name | Optionally, specify a different display name instead of the default "Compound Annual Growth Rate ([Column Name])". |
| Axis | Specify the axis over which to calculate
the nodes.
Only categorical axes that perform some kind of grouping can show up in the drop-down list. This means that if you only have a grouping on the X-axis, then this is the only axis available, whereas if you also have colored by a categorical column then the Color axis will be available as well, and so on. |
| Number of steps | Define the number of steps between the nodes to compare. If the number of steps is -1, then the difference will be calculated between the current node and the one before it. If the number of steps is 1, then the difference will be calculated for the current node and the one following it. |
| Formatting | Change the formatting of the axis. For example, change to Number to show the values in numbers rather than as percentage. |
| Hide Empty Values | Creates a Show/Hide rule that hides all
empty values. Click the properties symbol
|