Shortcuts to frequent custom expressions
Some custom expressions are more commonly used than others, for example, moving average and cumulative sum. Shortcuts to a number of the most common expressions are provided in the list of aggregation methods in the column selector on an axis, so you do not need to type these expressions yourself. Which shortcuts that are available depends on what kind of data you have selected on the axis in question in the visualization.
![](../../images/shortcut_exp_overview.png)
- In the installed client,
this is done in the expanded axis selector:
- In the web client,
right-click the column selector, and select
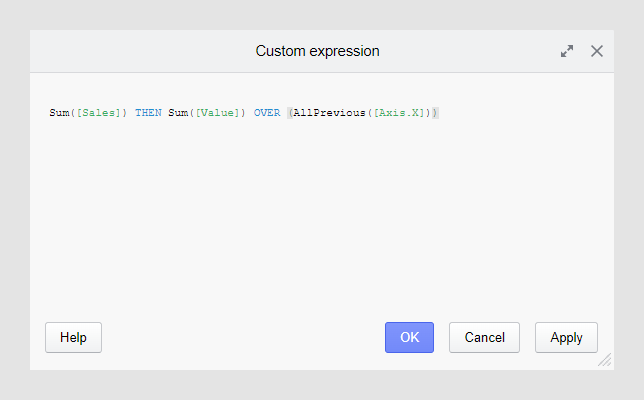
Custom expression:
The Custom expression dialog will open, where you can view and edit the expression.
The expressions
- an OVER statement and a node navigation method
- a THEN keyword and a [Value] column.
To understand how to evaluate the expressions, these concepts need an explanation.
The OVER statement and the node navigation method
- the OVER statement tells that slices outside of the current slice should be used when evaluating the expression,
- and the node navigation method tells which slices to use.
The THEN keyword and the [Value] column
The use of the THEN keyword makes it possible to evaluate an expression on already aggregated data. The part of the expression before the THEN keyword is calculated first.
The temporary column called
[Value]
represents the result of the entire (already
aggregated) expression before the THEN keyword.
Examples of expression shortcuts
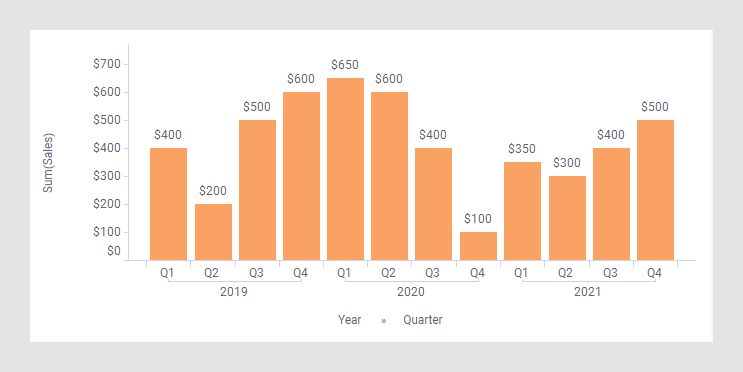
What is calculated when applying each of the shortcut expressions in the rectangle above is explained in the following topics. All the topics (except the Top Category topic) use the bar chart below as input.
![](../../images/shortcut_exp_reference_vis.png)
- Cumulative Sum
A Cumulative Sum, or running total, displays the total sum of data as it grows with time, or with any other series of data. The total contribution so far of a given measure is calculated for each item (slice) in the visualization. - Moving Average
A Moving Average, also called rolling average, rolling mean, or running average, calculates the average of the items (slices) within a specified interval. For example, if the interval size is set to three, the average is calculated on the current item and the two preceding items. The purpose of using a moving average is often to smooth out short-term fluctuations and to spot long-term trends. - Difference
The Difference expression shortcut calculates the difference between two nodes. The nodes should be on the same level in the hierarchy, and you can specify how many steps there should be between the nodes to be compared. - Difference %
The Difference % expression shortcut calculates the difference in percent between two nodes. The nodes should be on the same level in the hierarchy, and you can specify how many steps there should be between the nodes to be compared. - Difference Year Over Year
The Difference Year Over Year expression shortcut calculates the difference between corresponding nodes in different years. For example, you can compare the sales in the first quarter of a given year with the first quarter the year before, or with the first quarter two years ago. - Difference % Year Over Year
The Difference % Year Over Year expression shortcut calculates the percentage difference between corresponding nodes in different years. For example, you can compare the sales in the first quarter of a given year with the first quarter the year before, or with the first quarter two years ago. - % of Total
The % of Total expression shortcut calculates how many percent of the total each node contributes with. - Year to Date Total
The Year to Date Total expression shortcut calculates the cumulative sum within each year. This shortcut is only applicable when you are having a time hierarchy including year on the X-axis. - Year to Date Growth
The Year to Date Growth expression shortcut calculates the relative difference between the cumulative sums for consecutive years. This shortcut is only applicable when you are having a time hierarchy including year on the X-axis. - Change Relative to Start
The Change Relative to Start expression shortcut calculates the percentage difference between a node and the first node. - Change Relative to Fixed Point
The Change Relative to Fixed Point expression shortcut calculated the percentage difference between each of the nodes and a node of your choice. - Compound Annual Growth Rate
The Compound Annual Growth Rate, CAGR, expression shortcut calculates the smoothed annual growth rate over a given time period. - Top Category
The Top Category expression shortcut is used to quickly visualize a winning category in a categorization visualization. For example, it can be used for coloring a map chart with winning political parties or products.