The filters export allows you to export different versions of the same analysis (or parts of it) based on filtering. Perhaps you have an analysis with sales data for the last five years and you want to create a report to view each year separately. Instead of manually adjusting the filter and exporting once for each filter value (in this case Year), you can use the filter export to export all the filter values of interest with one single export operation and to one single document. The filter values will then automatically be applied during the export, and the result will be a PDF document where you can view each exported part of the analysis for each of the five years.
Note: Filtering that has been made in the analysis will be included in the export when you export filter values. If you want the PDF to be filtered only on the exported filter values, make sure you Reset All Filters before you export to PDF.
To export filter values:
Select File > Export > To PDF....
Response: The Export to PDF dialog is opened.
On the General tab, specify what parts of the analysis to export, what to include in the export and define the desired page layout.
Comment: If you are uncertain about the different alternatives under Export what, see Result from export based on filter values below.
Optionally, go to the Advanced tab to adjust additional settings. For instance, you can change the graphics mode to raster graphics for some visualizations to keep the file size down. Or, you can add headers or footers to be shown in the resulting PDF document.
Go to the Filters tab.
Select the check box Export selected views based on filter settings below.
Response: The settings in the lower part of the dialog are enabled.
If your analysis uses more than one data table, select the Data table from which you want to export.
Optionally, limit the number of filters shown in the Filter values list by specifying a value under Show only filters with n or less values.
Under Filter, select which filter you want to export filter values from.
In the Filter Values list, select the filter values you want to export.
Click Export.
Specify a file name and where you want to save the PDF document.
Click Save.
Response: If you selected the check box Open in PDF reader after export on the General tab, the resulting PDF document will be opened in your default PDF reader.
Comment: See Details on Export to PDF – General and Details on Export to PDF – Advanced for detailed descriptions of the available settings on the General and Advanced tabs.
Result from export based on filter values
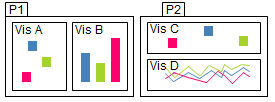
This example describes what the PDF document will include depending on the selection you make under Export what on the General tab. The example analysis has two pages (P1 and P2), with two visualizations on each page (Vis A, Vis B, Vis C, and Vis D).
Analysis without any filtering applied:
The filter of interest contains two filter values that you want to export (FV1 and FV2).
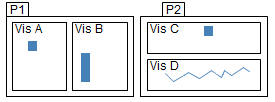
Analysis filtered to filter value FV1:
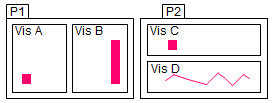
Analysis filtered to filter value FV2:
The table below shows what the PDF document will include for each of the alternatives in the Export what drop-down list:
Export what |
Resulting PDF document |
Active visualization |
Two PDF pages: 1. Vis A (FV1 applied) 2. Vis A (FV2 applied) |
Active page |
Two PDF pages: 1. P1 (including Vis A and Vis B; FV1 applied) 2. P1 (including Vis A and Vis B; FV2 applied) |
Active page (new page for each visualization) |
Four PDF pages: 1. Vis A (FV1 applied) 2. Vis A (FV2 applied) 3. Vis B (FV1 applied) 4. Vis B (FV2 applied) |
All pages |
Four PDF pages: 1. P1 (including Vis A and Vis B; FV1 applied) 2. P1 (including Vis A and Vis B; FV2 applied) 3. P2 (including Vis C and Vis D; FV1 applied) 4. P2 (including Vis C and Vis D; FV2 applied) |
All pages (new page for each visualization) |
Eight PDF pages: 1. Vis A (FV1 applied) 2. Vis A (FV2 applied) 3. Vis B (FV1 applied) 4. Vis B (FV2 applied) 5. Vis C (FV1 applied) 6. Vis C (FV2 applied) 7. Vis D (FV1 applied) 8. Vis D (FV2 applied) |
Details-on-Demand |
The number of resulting PDF pages when exporting the Details-on-Demand depends on how many rows that are marked in the analysis, and whether or not you have selected to export table rows not visible on screen. |
See also:
Exporting to Microsoft PowerPoint