You can export to PDF in three different ways. With regular export, you can export selected visualizations or pages as they currently appear in the analysis. With bookmarks export and filter export, selected bookmarks or filters are applied during the export. Regular export is described below, bookmarks export and filter export are described in Exporting Bookmarks to PDF and Exporting Filter Values to PDF, respectively. Note that you need to have a PDF reader installed on your computer in order to view an exported PDF document.
Regular export
This is the type of export you should use when you simply want to export what you see in the analysis to a PDF document. Perhaps you have discovered something interesting by filtering the data, and you want to share the insight with a colleague by sending a single visualization as a PDF document. Or, it may be that you have set up the entire analysis with many different visualizations and pages in a certain way, and you want to export it to PDF to be able to send it as a report to your colleagues.
To export what you currently see in the analysis to PDF:
Select File > Export > To PDF....
Response: The Export to PDF dialog is opened.
On the General tab, specify what parts of the analysis to export, what to include in the export, and define the preferred page layout.
Comment: If you are uncertain about the different alternatives under Export what, see Result from regular PDF export below.
Optionally, go to the Advanced tab to adjust additional settings. For instance, you can add headers or footers to be shown in the resulting PDF document. Or, you can change the graphics mode of selected parts of the export.
When you are done, click Export.
Specify a file name and where you want to save the PDF document.
Click Save.
Response: If you selected the check box Open in PDF reader after export on the General tab, the resulting PDF document will be opened in your default PDF reader.
Comment: See Details on Export to PDF – General and Details on Export to PDF – Advanced for detailed descriptions of the available settings on the General and Advanced tabs.
Result from regular PDF export
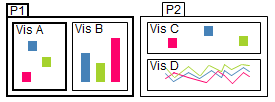
This example describes what the PDF document will include depending on the selection you make under Export what on the General tab. The example analysis has two pages (P1 and P2), with two visualizations on each page (Vis A, Vis B, Vis C, and Vis D), as seen in the image below:
In the example analysis, page P1 is the active page, and Vis A is the active visualization on that page. The table below shows what the PDF document will include for each of the alternatives in the Export what drop-down list:
Export what |
Resulting PDF document |
Active visualization |
One PDF page: 1. Vis A |
Active page |
One PDF page: 1. P1 (including Vis A and Vis B) |
Active page (new page for each visualization) |
Two PDF pages: 1. Vis A 2. Vis B |
All pages |
Two PDF pages: 1. P1 (including Vis A and Vis B) 2. P2 (including Vis C and Vis D) |
All pages (new page for each visualization) |
Four PDF pages: 1. Vis A 2. Vis B 3. Vis C 4. Vis D |
Details-on-Demand |
The number of resulting PDF pages when exporting the Details-on-Demand depends on how many rows that are marked in the analysis, and whether or not you have selected to export table rows not visible on screen. |
Note: If you select the check box Trellis panels and table rows not visible on screen on the General tab, tables and trellised visualizations may be extended to more than one PDF page for the export options where each visualization is exported to a new page.
See also:
Exporting Filter Values to PDF