Example 2: Visual Data Mining
Statistica and Statistica Data Miner include a large selection of graphs and charts that can be specified and edited interactively or inserted as nodes into a workspace. The purpose of this example is to illustrate how graphical methods alone can provide valuable insights into interesting (important) relationships between the variables in a data set.
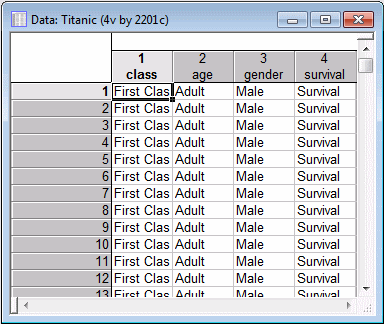
This example is based on the example data file Titanic.sta, which contains information on the gender, age, type of accommodation, and ultimate survival status for the passengers of the ill-fated vessel.
The purpose of this analysis is to determine, by means of graphical data analyses alone, which passengers had the greatest chances of survival.
- Ribbon bar
- Select the
Home tab. In the
File group, click the
Open arrow and on the menu, select
Open Examples. The
Open a Statistica Data File dialog box is displayed. Titanic.sta is located in the
Datasets folder. Select the
Data Mining tab. In the
Tools group, click
Workspaces, and select
All Validated Procedures.
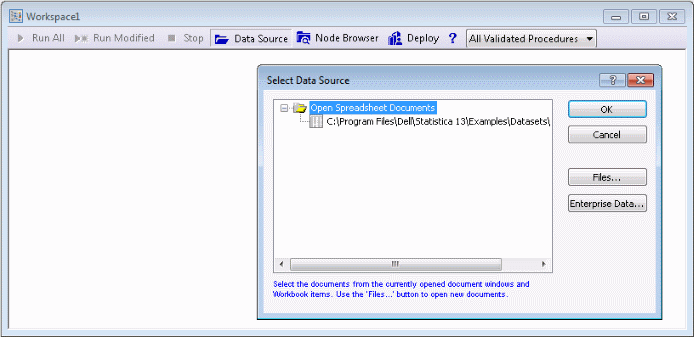
A blank Statistica workspace and the Select Data Source dialog box are displayed. The Titanic.sta data file is displayed in the Select Data Source list because the data file was opened before the workspace was opened.
If the data file had not been opened before the workspace was opened, you would click the Files button, and browse to and open the desired data file (in standard installations, example data files are located in C/Program Files/Statistica/Statistica */Examples/Datasets).
Select the Titanic.sta data file in the list, and click OK to insert the data source node into the workspace.
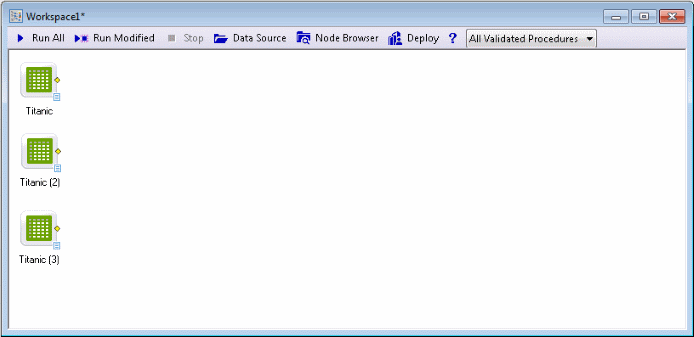
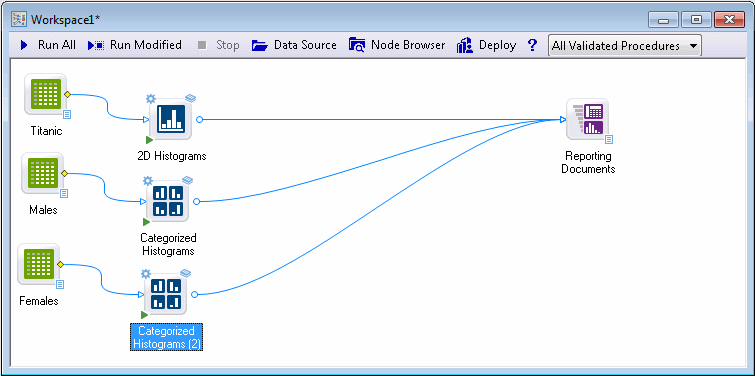
Select the data source node, press Ctrl+C on your keyboard to copy it, and press Ctrl+V two times to add two copies to the workspace.
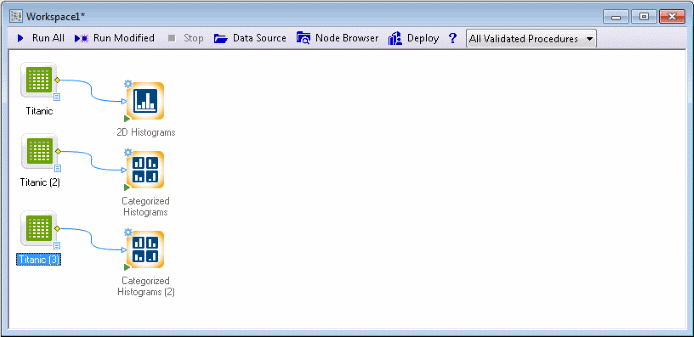
Select the first data source node, select the Graphs tab, and in the Common group, click Histogram.
Select the second data source node. On the Graphs tab, in the More group, click Categorized and from the menu, select Histograms. Repeat this with the third data source node.
Double-click the first data source node. Click the Variables button. Select class, age, and survival. Click OK.
In the 2D Histograms dialog box, on the Quick tab, in the Fit type group box, clear the Normal check box, and click OK.
Selecting different subsets of cases
We copied/pasted multiple instances of the data source into workspace so that we can specify different case selection conditions for two of them. Specifically, by selecting males and females separately, we can perform subsequent analyses on all observations combined, and for males and females separately.
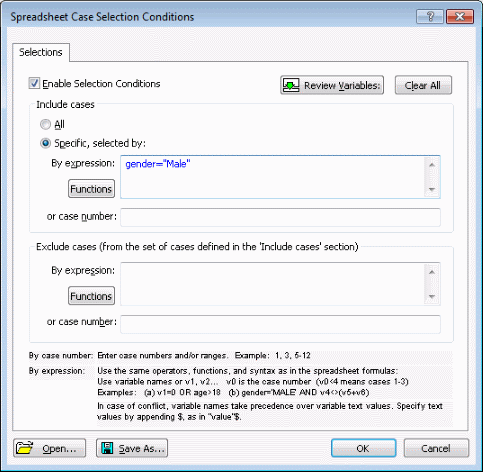
Double-click the Categorized Histograms node connected to the second data source node. At the bottom of the Categorized Histograms dialog box, click the Select cases button.
Note: the case selection conditions specified in this dialog box only apply to the particular copy of the input descriptor, and not the underlying data file. Hence, you can specify different case selection conditions for different data sources, even when they reference the same actual data file.Specify selection conditions to include only male passengers:
Select the Enable Selection Conditions check box. Select the Specific, selected by option button. In the By expression field, type gender="Male".
Click the OK button.
In the Categorized Histograms dialog box, click the Variables button. In the Variables list, select survival. In the X-Category list, select class. In the Y-Category list, select age.
Click OK in the variable selection dialog box, and click OK in the Categorized Histograms dialog box.
Rename the data source node: right-click the Titanic (2) node, and select Rename. Name the node Males.
Double-click the Categorized Histograms node connected to the third data source node, and repeat the process, but for the expression, type gender="Female", select the same variables, and rename the data source node Females.
For this example, we will skip the usually necessary step of data cleaning and filtering illustrated in Example 1 (see also for a discussion of Crucial Concepts in Data Mining). Because we already know that all data in the input file are properly coded, etc., we can proceed directly to the data analysis.
Run the workspace.
Reviewing results
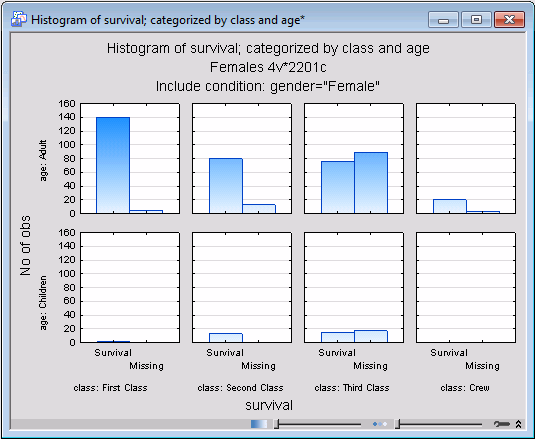
Double-click on the Reporting Documents node to review the graphs generated in this simple example. Perhaps the most revealing plot is the categorized histogram of survival by age and class, for the female passengers only.
Apparently, the survival chances of women in first class were markedly better than the survival of women in second class; in third class, the survival chances for women were about 50/50; only very few women overall were on the voyage as crew members; apparently, their survival chances were better than 50%. If you compare this histogram with that for male travelers and crew members (not shown here), it is clear that men's survival chances were less than 50% regardless of class, and particularly bleak for third class travelers and crew. So clearly, women in first class had a much better chance of survival overall, perhaps a testimony of a time of greater gallantry, and third class travelers and crew members had much worse chances of surviving the Titanic disaster, attesting to the great importance of social class membership at the time. We will again look at this data file and more detailed results in Example 4.
- Summary
- The purpose of this example is to provide an illustration, using real-world data, of how relatively simple descriptive graphs can sometimes reveal important information about the relationships between variables in the data. Statistica Data Miner offers a large selection of graphs and charts that can be combined with all other functionality of the program, making it possible for you to combine numeric methods with visual data mining techniques, or to perhaps even use visual techniques (graphical methods) exclusively throughout your project.
See also, Data Mining Definition, Data Mining with Statistica Data Miner, Structure and User Interface of Statistica Data Miner, Statistica Data Miner Summary, and Getting Started with Statistica Data Miner.