Viewing History and Notifications
Viewing Artifact and Project History
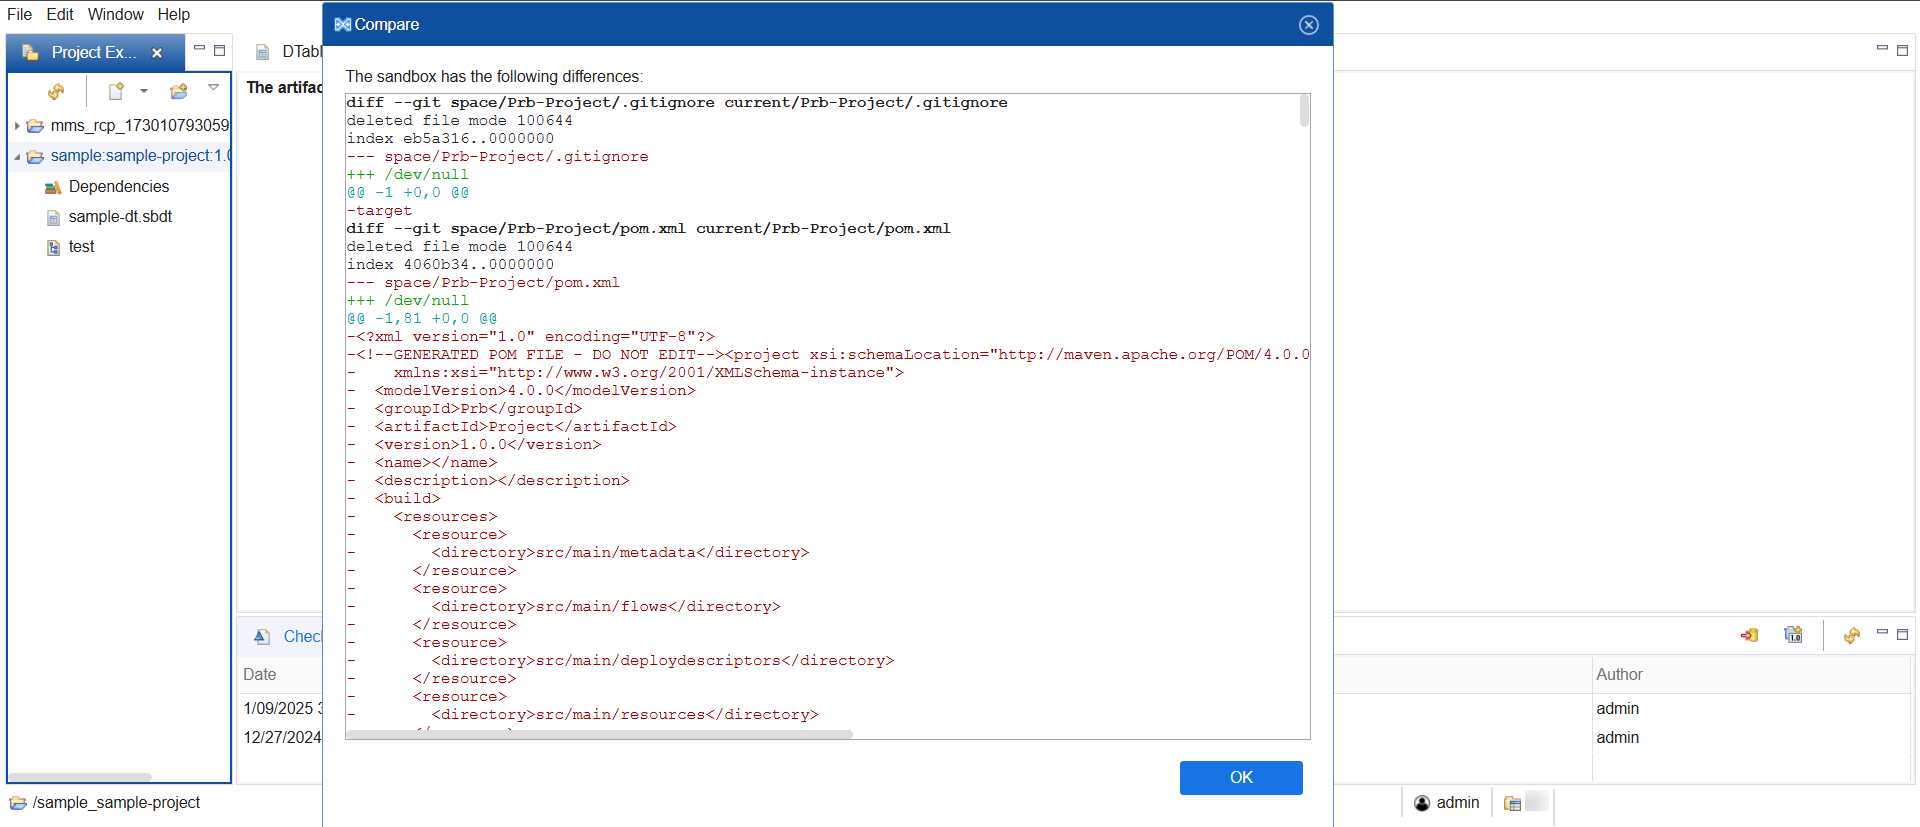
TIBCO Streaming Model Management Server (MMS) provides a mechanism for comparing the current state of the sandbox with the backing space or checkpoints at different points in time. Since the underlying backing space uses Git as its version control system (VCS), the format of the comparison is as a git diff command. The following comparisons can be performed:
- Current sandbox state and backing space.
- Current sandbox state and a previous checkpoint.
- Current sandbox state and the initial state of the sandbox when it was created (before any checkpoints).
To view the comparisons, right-click anywhere in the Project Explorer view and select Compare With, then select either Backing Space or Checkpoint.
Note: You cannot compare with the backing space if there are any modifications in the sandbox.
The example below shows the differences between the sandbox and the backing space for this particular user.
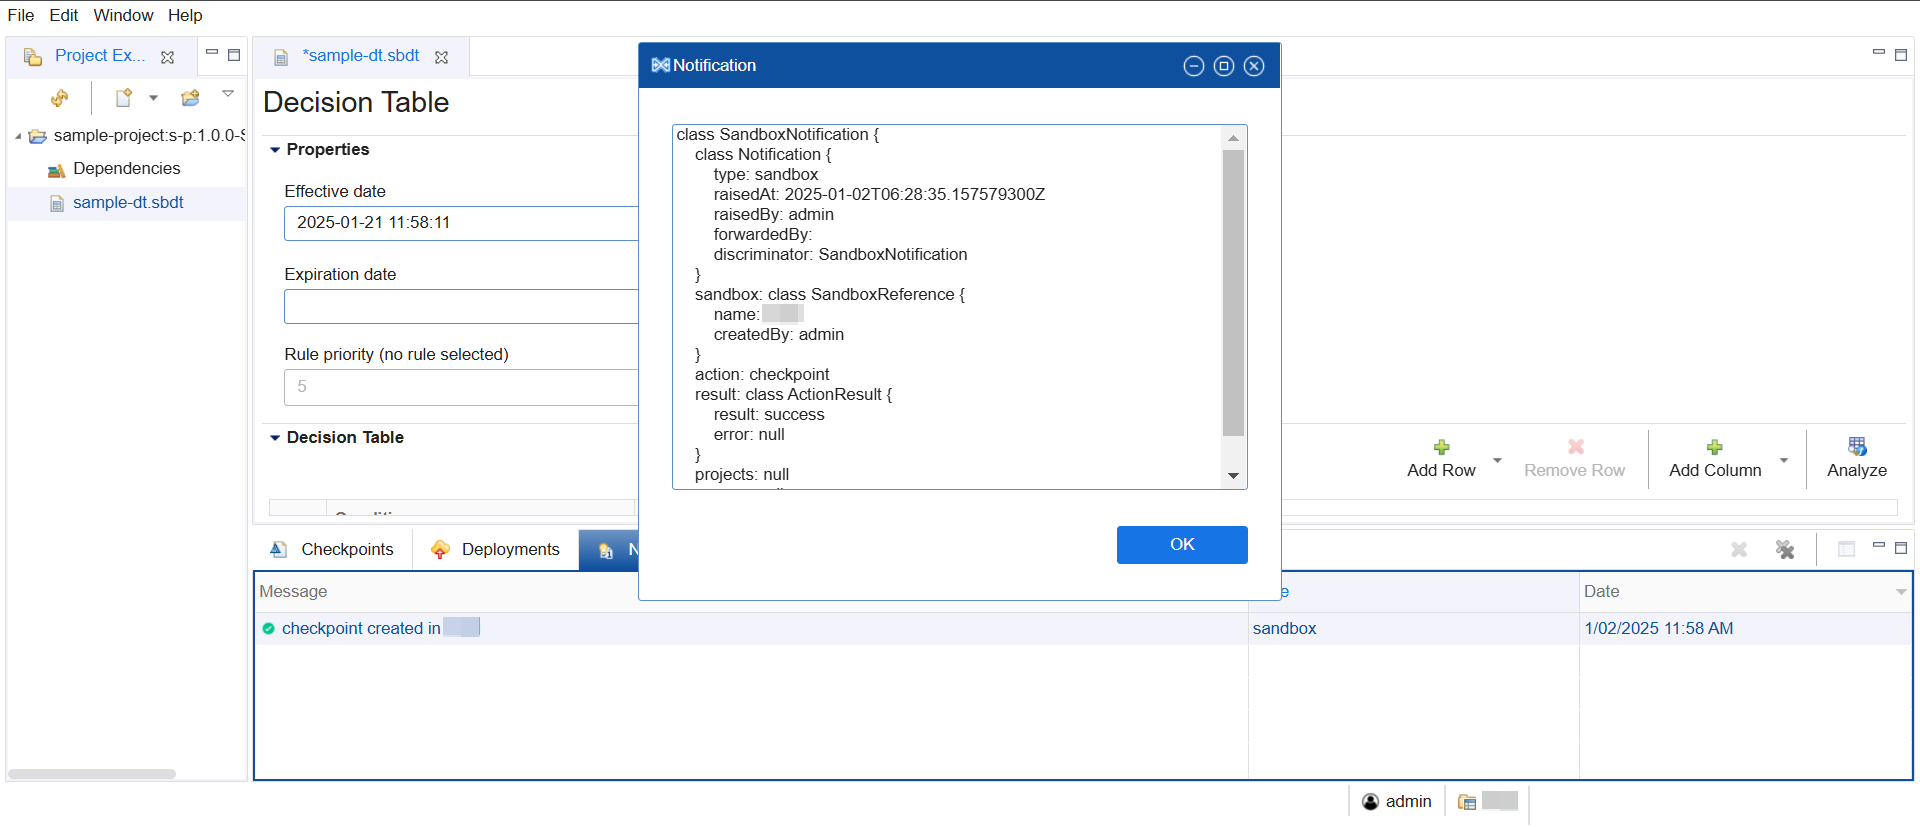
Notifications View
Notifications inform you of artifact, project, and deployment status. To view the notifications, on the top-level menubar select Window > Show View > Notifications OR select the Notifications tab in the bottom folder to activate the pane.
The detailed notification view allows you to copy notification details to the clipboard. To view a notification in detail, you can,
- Double-click the notification OR
- Right-click the notification and select View Notification Details.
To delete a notification,
- Select the notification and click the X icon.
- Right-click the notification and select Delete Notification.
To delete all notifications,
- Select a notification and click the
 icon.
icon. - Right-click a notification and select Delete All Notifications.
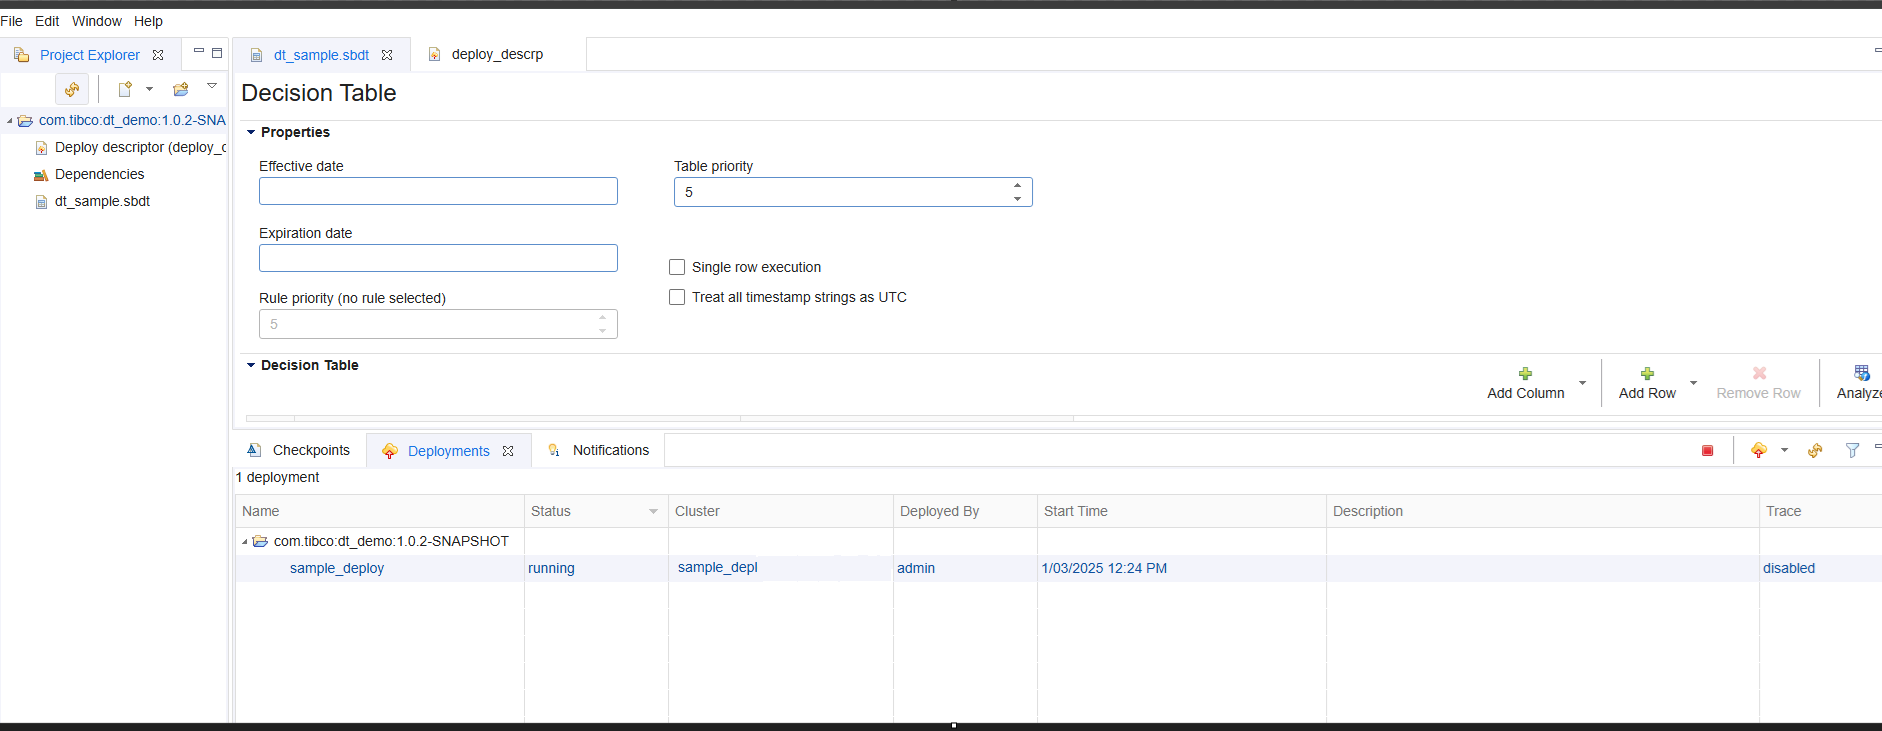
Deployments View
MMS retains artifact deployment data for both successful and unsuccessful deployment to a StreamBase EventFlow module. The Deployments view only shows active deployments including completed or error deployments. Notifications are used to display the status of the Streaming cluster.
To view the current deployments, on the top-level menubar select Window > Show View > Deployments OR select the Deployments tab in the bottom folder to activate the pane.
The following fields are displayed in the Deployments view:
Name: Name of the deployed project.Status: Deployment status. Status can be pending, running, shutdown, completed, or error.Cluster: Name of the Streaming cluster that this deployment is targeting.Deployed By: Deployment user.Start Time: Deployment Start time.Description: The description of the deployment.Trace: The trace state of the deployment. It can be enabled or disabled. To change the trace state, right-click on the deployment and select Toggle Trace.
The different types of deployment status are as given below:
- Pending: Not running but still starting up.
- Running: Running normally.
- Shutdown: Terminated manually.
- Completed: Terminated automatically due to result set completion or runtime expiration.
- Error: Terminated abnormally.
The following example shows the deployment status for an artifact named dt_sample.sbdt.