 in the authoring bar).
 The first thing to do when you start working with Spotfire is to add some data to analyze. You can load data into the internal data engine of Spotfire (in-memory analysis) from a number of different sources:
by pasting data from the clipboard,
by dragging and dropping or opening simple text files, Microsoft Excel files or SAS files (or additional file sources if such have been configured by your company),
by importing data from a database or other data source using data connections,
from an information link (a predefined connection to a shared data source),
from a data function designed to load data,
or, by connecting to a database via ODBC or OLE DB.
Spotfire also supports in-database (in-db) connections to external data sources, such as Microsoft SQL Server Analysis Services, Oracle, Teradata, Spotfire Data Streams, etc. When a connection to an external source is set up with in-db data tables, all calculations are done by the external data source and not by Spotfire. See Working With In-Database Data and Working with Streaming Data for more information.
You add data (or open predefined analyses) from the Files and data flyout (reached by clicking in the authoring bar).
The Files and data flyout contains a number of different elements:
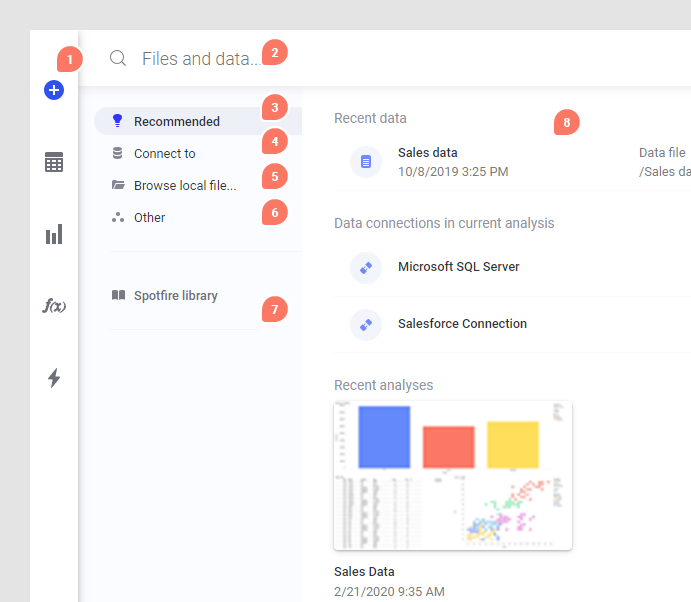
1. The plus-sign is the access point to the Files and data flyout.
2. Search for files, data sources and data in the upper part of the flyout. You can specify what item type to search for using keywords as described in Searching the Library.
3. The Recommended view will show different things depending on the context. For example, you may find sample data, or, recent analyses or recent data here.
4. Under Connect to, you will find a list of all available data connectors. Click on a connector to see a list of data connections from that source in the analysis, in the library, or to create a new connection.
5. Click Browse local file to choose data from one or more file sources, or to open local DXP files.
6. Under Other, you can Paste data from clipboard, open Information Designer, add a Linked copy to data table in analysis (previously known as "data table from current analysis" or "data table data source"), or open data from databases which currently do not have a native data connector (which otherwise is the preferred option).
7. Click Spotfire library to locate folders and files by browsing the library structure.
8. The right part of the flyout shows the available options for the selected category. For example, here you will find recent analyses or recent data, a list of available data connectors, files or folders in the library, or other types of access points.
Adding more data
Data can be added to the analysis in several different ways: as new columns, as new rows or as new data tables. All of these methods are available when you add data from the Files and data flyout. If Spotfire identifies that new data seems to fit in an already available data table, you might get a recommendation to add the data as new rows. However, you can always ignore the recommendation. See Choosing How to Load the Data for more information.
Adding data as separate data tables is useful if the new data is unrelated to the previously opened data table, or if the new data is in a different format (pivoted vs. unpivoted).
If you have a visualization made from a particular data table which has filtering and marking that you would like to apply to visualizations made from another data table, then you must define a relation between the two tables. For a relation to be useful, you must have one or more key columns (identifier columns) available in both data tables, and use these to define which rows in the first data table will correspond to rows in the second data table. If you need more than one key column to set up a unique identifier, you must add one relation for each identifier column. If a relation is necessary, click Data > Data table properties and go to the Relations tab to define the relations.
You can often combine data from different data tables in one visualization without having a relation between them, if at least one column match between the data tables. Columns match if they have the same data type. If two columns are of the same data type and have the same name, Spotfire will match them automatically during loading. You can view and edit column matches in the Data Table Properties dialog. To learn more about using many data tables in the same visualization, see Multiple Data Tables in One Visualization.
In some cases, when you need to bring in-memory data from different data sources together in a single visualization, it may be more suitable to add columns or add rows to a data table, rather than keeping two different data tables.
With in-database data tables you can often join several database tables into a single virtual data table before adding it to Spotfire. See Details on Views in Connection for more information.
Tip: To show a simple line from a different data table in a scatter plot, see Details on Line from Data Table.
See also: