Example - Association Rules Applied to Consumer Preferences
This example is based on the Fastfood.sta data file, which is also described in some detail in Example 6: Tabulating Multiple Responses and Dichotomies of Basic Statistics.
- Description of data file
- Suppose you conduct a survey of consumer preferences of young adults. Specifically, you are interested in young consumers' 1) preferences for different types of fast food (favorite fast food), 2) preferences for different types of automobiles, and 3) actual (self-reported) past patronage of specific fast-food restaurants. In addition, you record the respondents' gender. These preferences are measured and entered into the data file FastFood.sta.
To illustrate the application of association rules and the interpretation of results, in this example only respondents' gender and food preferences will be analyzed. The variables of interest in this example are identified and described below:
Gender (dichotomy variable). The respondents' gender is recorded and entered as a dichotomy variable (Gender) into the data file (i.e., Male, Female).
Favorite fast-food (multiple response variable). The questionnaire used for this study asks the respondents to select their favorite (up to) three choices of commonly available fast foods from a list of eight different types. The eight different types of fast food presented to the respondents are:
(1) Hamburgers
(2) Sandwiches
(3) Chicken
(4) Pizza
(5) Mexican fast-food
(6) Chinese fast-food
(7) Seafood
(8) Other ethnic or regionally popular fast-food
The three choices that each respondent makes are entered into the data file as a multiple response variable, that is, their first choice is entered into variable Food_1 (first preference or favorite fast food), their second choice (if available) is entered into variable Food_2, and their third choice into variable Food_3.
Purpose of the Analysis
In this step-by-step example, we aim to extract association rules from the data set FastFood.sta for constructing association rules relating to gender and various types of fast food consumption.
Specifying the Analysis
Open the data file Fastfood.sta via the File - Open Examples menu; it is in the Datasets folder. Select Sequence, Association, and Link Analysis from the Data Mining menu to display the Link analysis Startup Panel, and click on the Quick tab.
Select the Non-sequential association analysis check box to specify that this is a nonsequential association analysis.
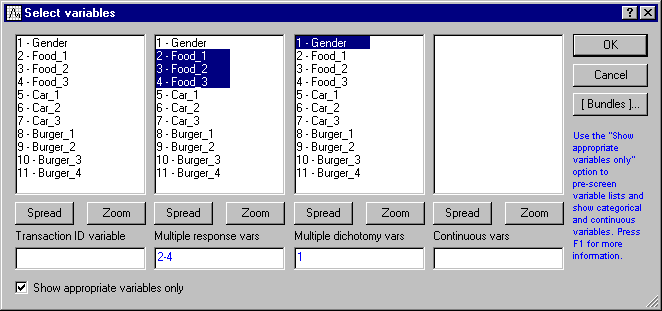
Click the Variables button and select Food_1 through Food_3 as the Multiple response vars, and select Gender as the Multiple dichotomy vars. There is no need to select the actual codes since the analysis will automatically pick up all distinct values found in the selected variables.
Click the OK button to close the variable selection dialog and return to the Link analysis Startup Panel.
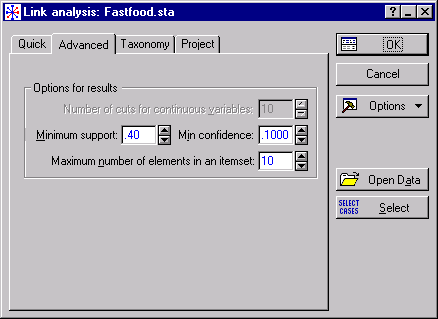
Next, click on the Advanced tab to specify the parameters that will guide the association algorithm for identifying the existing rules.
For this example, change the Minimum support value to .40, and leave all other options at the defaults. This will ensure that only rules achieving this level of support will be included in the results.
NOTE: In general, you may always want to start with the default settings for these parameters. If no association rules satisfying these conditions (i.e., with the required minimum support and minimum confidence) can be found in the data, STATISTICA SAL will issue a warning to that effect. You can then gradually relax these conditions, i.e., require lower minimum support and minimum confidence until a reasonable number of association rules can be found.
The parameter Maximum number of elements in an itemset can be used to control the complexity of rules derived from the data. Remember that in general, association rules have the form If Body then Head. Thus an association rule involving 10 items on each side of this rule would be quite complex and may also have a small support value.
- Selecting taxonomies
- The items in the FastFood.sta file are referred to with their real and descriptive names. However, sometimes it may be more convenient to refer to items in the original data set with given IDs. This convention is particularly useful for large data sets with long item names. However, in cases like this, you may still want to include or replace the item IDs with real and descriptive names in your results (spreadsheets and graphs). To do this you need to have a taxonomy data file, which maps each item ID onto a descriptive and recognizable name. This functionality can be accessed using the Taxonomy tab. For further details, see the Selecting taxonomies section of the step-by-step example for sequence analysis.
- Saving models into database files
- STATISTICA SAL uses state-of-the-art database technology, which makes rule extraction fast and memory efficient. All extracted rules and, hence, the model itself, are stored in a database (.dbs) file. The default name and location of this file is "C:\Documents and Settings\USER\My Documents\Default.dbs". However, you can change this information in a way that suits your analysis best, e.g., "C:\FastFood.dbs". You will need this file later on for deploying/updating your association model (see below).
To initiate rule extraction, click the OK button. If a database file with the specified name and location exists, then a user information message will be displayed. If you click the Yes button, the analysis will proceed and the existing file will be deleted (contents will be lost). However, if you want to keep the file, which may contain valuable rules extracted from previous analyses, click the No button. This will cancel the association algorithm and return you to the Link analysis Startup Panel where you can specify a new name and location for saving the database file. Click the OK button again to initiate the rule extraction algorithm and display the Results dialog.
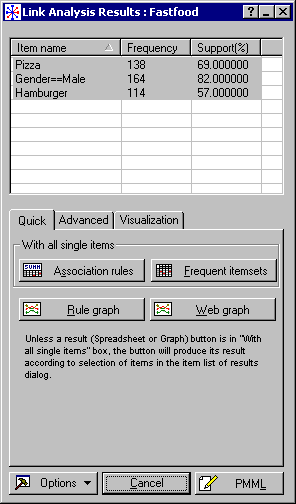
Reviewing Results
In the Item name list located at the top of the Results dialog, you can select any number of items, a functionality that can be used in conjunction with generating certain types of spreadsheets and graphs only for the selected items, e.g., rule and Web graphs (see below). To select a continuous range of items in sequential order, click on the first item in the range, hold down the SHIFT key, and click on the last item in the range. To select a number of items that are not in sequential order, press the CTRL key and click on the items one by one. To extend an existing selection by adding a new item, or to remove an item from the current selection, hold down the CTRL key and click on the item.
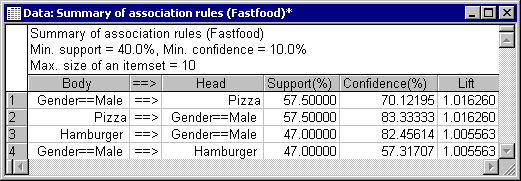
The first thing you may want to review is the association rules in spreadsheet format. Click the Association rules button on the Quick tab to display this results spreadsheet.
We have four rules that associate males (Gender=Male) with certain food preferences:
- If Gender=Male then Pizza
- If Pizza=Male then Gender=Male
- If Hamburger then Gender=Male
- If Gender=Male then Hamburger
The interpretation of these results - and this is one of the strengths of the association rules method in general - is rather apparent: Males like Pizza and Hamburger (in this sample).
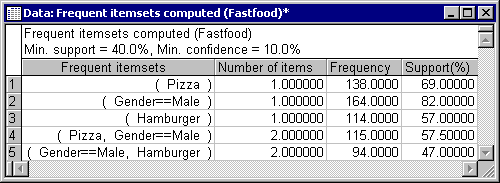
Similarly, you can display the list of frequent items in spreadsheet format by clicking the Frequent itemsets button.
NOTE: The options described above for generating the summary of association rules and frequent itemsets are also available on the Advanced tab.
Instead of generating spreadsheets of rules and frequencies for all items, you may want to display such outputs only for a number of selected items. To do so, select the items of interest from the Item name list. Select the Advanced tab and click the Frequent itemsets only with selected items and Rules only with selected items buttons. You can also generate spreadsheets of rules where the selected items appear either as Bodies or as Heads using the Rules only with selected items as bodies and Rules only with selected items as heads options, respectively.
- 2D and 3D graphs
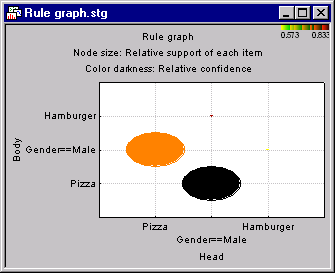
- Next you may want to review the association rules your analysis has discovered in the form of graphs. First, select the items for which you want to create rule or Web graphs. Note that at least two items must be selected in order to generate such outputs. Click the Rule graph button to produce the graphical summaries of the association rules.
This summary is simply a 2D graphical representation of the information displayed in the Summary of sequential rules spreadsheet. The 2D association rule graph provides a summary of all the important information regarding the rules derived from the data. It is easy to see how all relevant statistics that describe the association rules are efficiently summarized in the sizes of circles and colors in this graph. Remember that association rules follow the general form If Body then Head. In this graph, the items identifying the Body of each rule are shown on the left side of the graph, the Head of each rule is shown on the right. The support and confidence values for the Body and Head portions of each association rule are indicated by the size and color of each circle.
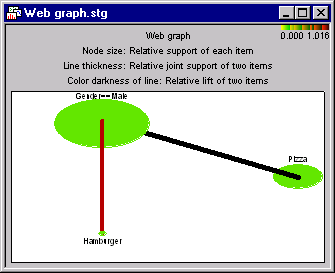
Next click the Web graph button. The same information will now be shown in a 2-dimensional display known as the web (or network) graph. As in the 2D rule graph, the support value of each item is indicated by the size of the corresponding circle (node) in the 2D plane. The thickness of a line and its color connecting between two items represent the joint support and lift for the two items, respectively.
From the above graph we can see that the support for the rule If Gender=Male then Pizza is particularly large (a result which we have already seen in the summary of association rules spreadsheet discussed above). From this graph we can also see considerable support for the rule If Gender=Male then Hamburger. Thus we can conclude that Males like Pizza and Hamburger.
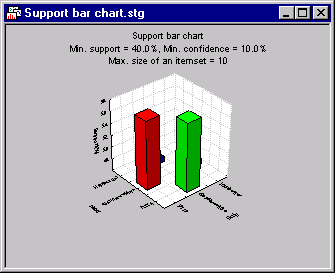
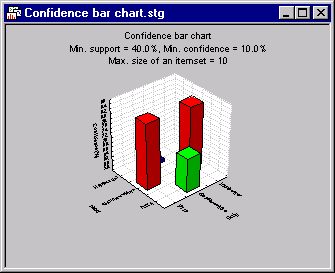
You can also create 3D histograms summarizing the values for support and confidence. To create these graphs, click the Support graph and Confidence graph buttons located on the Advanced tab.
This graph shows, for example, that the confidence value (conditional probability) for the rule If Pizza then Gender=Male is relatively low (compared to the other rules).
- Saving models for deployment
- When your analysis is complete, you may want to save the association model you just built in PMML (Predictive Markup Model Language) format. PMML files can later be loaded and used in STATISTICA SAL using the deployment functionalities provided on the
Project tab of the
Link analysis Startup Panel. To save the association model in a PMML file, click the PMML button located at the bottom of the
Results dialog.
This will display a standard Save As dialog where you can send the output of the code generator to a single file with a name that you specify.
To finish the current analysis, click the Cancel button. This will take you back to the Link analysis Startup Panel where you can perform other analyses using the same or a different data set.
Deployment
Deployment enables you to apply existing link models, created from previous analyses, to new data in order to make further predictions (in STATISTICA SAL, models are saved either in database or PMML formats). This vital and important functionality is provided on the Project tab of the Link analysis Startup Panel. You can display this dialog by either selecting the Sequence, Association, and Link Analysis from the Statistics menu or by clicking the Cancel button on the Link Analysis Results dialog. Click the Project tab.
Select the Use existing project option button to enable the rest of the controls displayed on this tab. At this point you have several choices:
1) You may want to use an existing database (.dbs) file to make predictions using the current data set. You can load an appropriate database file of your choice by clicking the Database file button. At this stage you can either select the Update new transactions option button to update your association model with new data (this will make sense only if your current data set contains new transactions) or the Go to results dialog without adding transactions option button, which will take you to the Results dialog where you can simply make predictions using the active data set (no model updating will be performed in this case).
2) Alternatively you may want to deploy an association model using a previously saved PMM file. To do so, select the Recommendation via PMML option button. This will enable the PMML file button in order to load a PMML file (these files are saved with the extension .xml).
NOTE: The options on the Quick tab, Advanced tab, and Taxonomy tab will be unavailable when using an existing project.
Next, click the OK button. Choice one (see above) will take you to the Results dialog (see Reviewing Results described above) where you can generate output in the form of spreadsheets and graphs.
The second choice will display a Results dialog specifically designed for making predictions using PMML files. For example, to make a simple query for the item "Pizza" as Body, enter the item name in the Enter antecedent itemsets(s) box as follows
("Pizza")
and then click the Query of rule button to produce a spreadsheet of rules involving "Pizza" as Body.
More complex queries are also possible such as
(Pizza; Gender=Male)
If no rules were found, which is likely for highly complex rules, STATISTICA SAL will issue a message to that effect.
Summary
This example illustrates the basic mechanism of applying association rule analysis for identifying relationships between variables, items, responses, etc. This method is particularly well suited for text and Web mining tasks of large data sets. When clear results can be derived, the results are always interpretable, understandable, and deployable, because they consist of very simple If "Body" Then "Head" rules.