Normality Tests
In statistics, normality tests are used to determine if a data set is well-modeled by a normal distribution. The tests also compute how likely it is for a random variable underlying the data set to be normally distributed.
Many statistical methods require that the data come from a normal distribution or at least can be reasonably approximated by a normal distribution.
-
Normal distribution: A normal random variable, y, has the normal density function, f, given as follows:
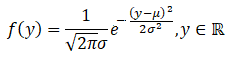
where µ and σ are the mean and standard deviation of y.
-
Multivariate normal distribution: The multivariate normal random vector, y = (y1, y2, …., yp)t, has the multivariate normal density function;
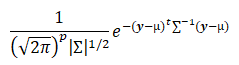
where µ = (µ1, µ2, …, µp)t is the mean vector and ∑ is the covariance matrix.
-
Tests of normality: In general, a statistical test for normality is usually of the following form:
where a small p-value indicates that the data do not follow a normal distribution.
If two or more variables are selected, then Mardia’s tests of multivariate normality based on multivariate skewness and kurtosis are available as well.
Anderson-Darling test
For a given sample x1 < x2 < ⋯ < xn of
n observations, the Anderson-Darling statistic is computed as follows:
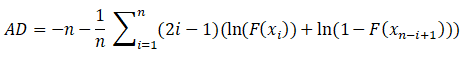
where F is the normal cumulative distribution function.
There are two versions of the Anderson-Darling test, one which assumes the parameters of the normal distribution (mean and standard deviation) are known and are equal to the sample estimates and one that does not assume the parameters are known.
Kolmogorov-Smirnov test
The Kolmogorov-Smirnov (KS) test of normality is based on the test statistic,
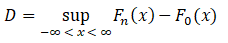
where, Fn is the empirical cumulative distribution function (CDF) and F0 is the normal CDF where the mean and the standard deviation are set to their sample estimates. When the parameters are assumed known and equal to the value of the sample estimates, the p-values reported are based off those tabulated in Massey (1951). When the parameters are assumed unknown, then the probability values tabulated by Massey (1951) are not valid and the probabilities tabulated by Lilliefors (1967) are used instead.
Shapiro-Wilk
The Shapiro-Wilk W test is the preferred test of normality because of its good power properties as compared to a wide range of alternative tests (Shapiro, Wilk, & Chen, 1968). Statistica implements an extension to the test described by Royston (1982), which enables it to be applied to large samples (with up to 5,000 observations).
Mardia multivariate normality tests
The Mardia multivariate normality tests are based on the multivariate extensions of skewness and kurtosis.
The two test statistics are as follows:
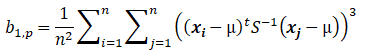
where n/6 b1,p has an approximate Chi-square distribution with (p(p+1)(p+2))/6 degrees of freedom.
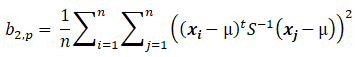
 has an approximate standard normal distribution.
Box-Cox transformation
The Box-Cox transformation transforms the original variable so that the new variable has a distribution that is as close to normality as possible.
The original variable, x, is transformed to y in the following manner.
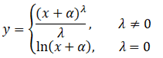
where α is the user-specified shift parameter and λ is the transformation parameter whose value is determined by maximum likelihood.