
Usage
This section helps ModelOps administrator to view the usage of all the active scoring pipelines.
To view usage details about scoring pipelines, click Settings and Preferences at the end of Project Explorer and select Usage > Scoring Pipelines.
You can see the graphical representation of scoring pipeline usage. The ModelOps UI offers two charts based on count and size. You can download all the usage data by clicking the Download All Usage Data (JSON) present at the upper-right corner of the page. You also get the option to see the usage graphs in stacked format by checking off the box for Stacked present below the graphs.
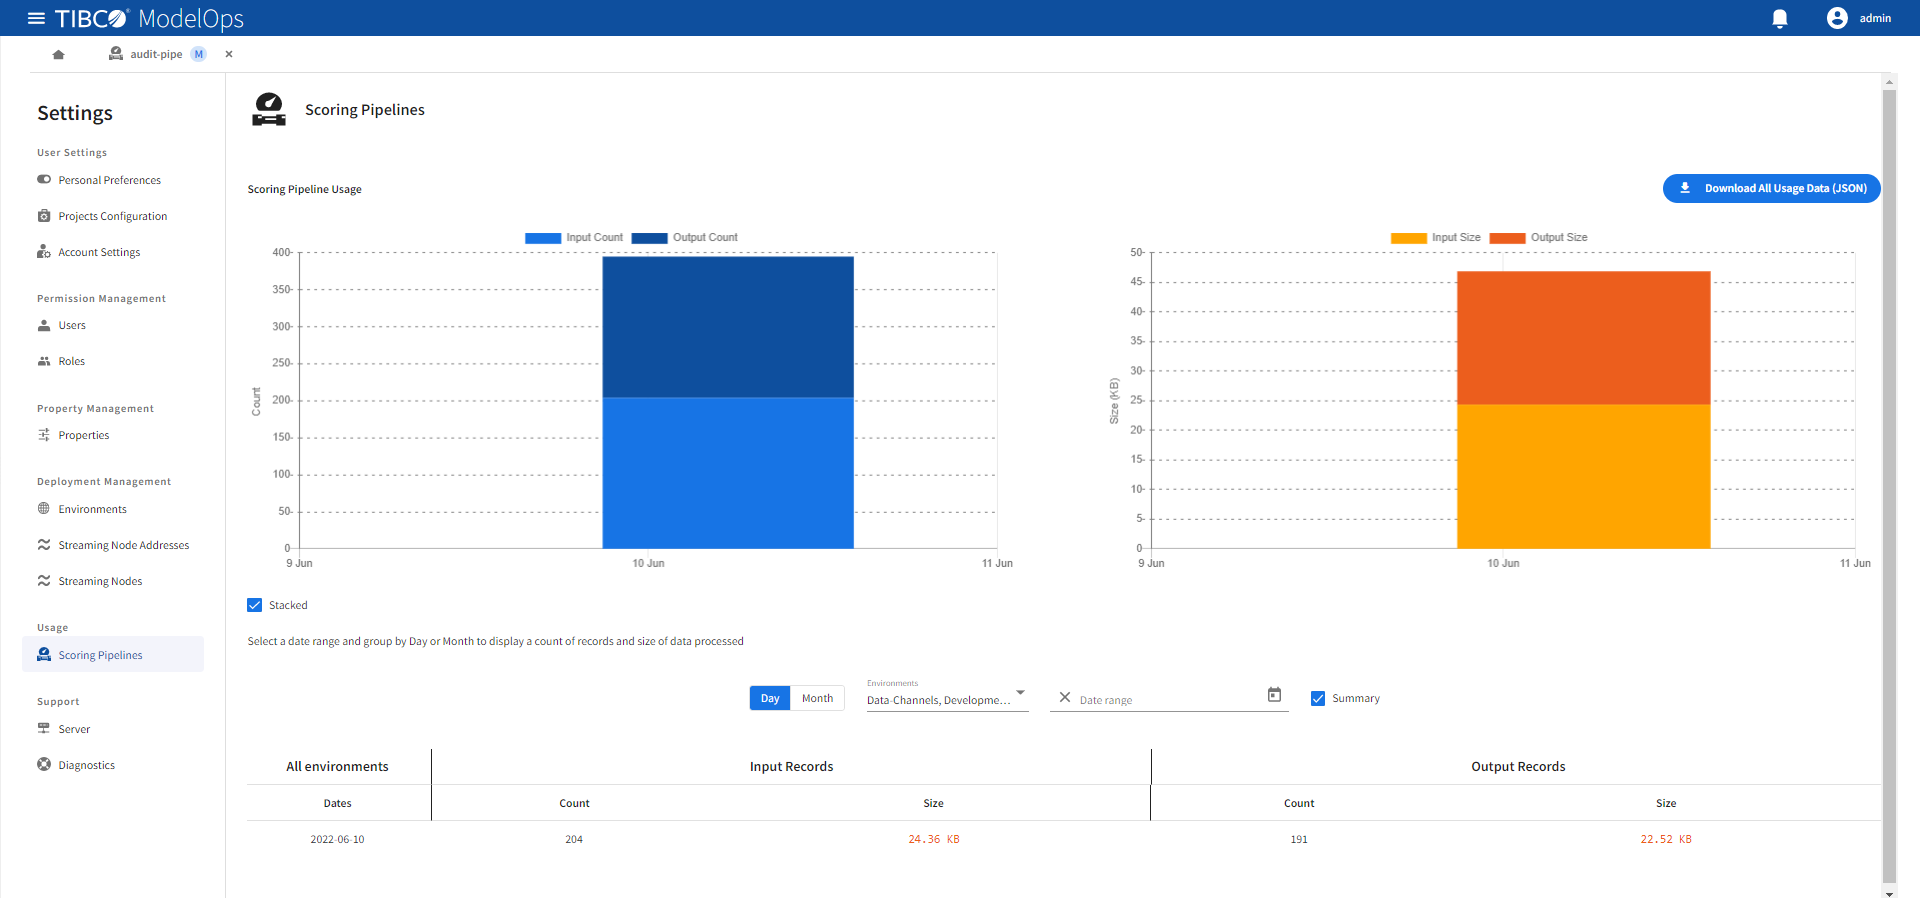
Administrators can also select a date range and group by day or month to display a count of records and size of data processed. You can also view data for specific environments. Administrators can view the input and output records based on count and size, too.