The Data Relationships tool calculates a probability value (p-value) for any combination of columns. This p-value can be used to determine whether or not the association between the columns is statistically significant.
(For a mathematical description of linear regression, see Data Relationships Linear regression algorithm.)
The linear regression option is used to calculate an F-test investigating whether the independent variable X predicts a significant proportion of the variance of the dependent variable Y.
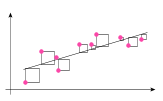
Linear regression, or the "least squares" method, works by minimizing the sum of the square of the vertical distances of the points from the regression line and obtain a correlation coefficient. The correlation coefficient can take values between -1 and +1. If there is a perfect negative correlation, then R=-1; if there is a perfect positive correlation, then R=+1. If R=0, then there is no correlation at all and the two columns are completely independent of each other.

(For a mathematical description of Spearman R, see Data Relationships Spearman R algorithm.)
The Spearman R option is used to calculate a nonparametric equivalent of the correlation coefficient. It is used on occasions when the variables can be ranked. Since it is only the rank of the values that is interesting in the calculation, Spearman R can be used even if the underlying distribution family is unknown, provided that each row can be assigned a rank. Similar to Linear regression, the correlation coefficient can take values between -1 and +1.
(For a mathematical description of Anova, see Data Relationships Anova algorithm.)
Anova means Analysis of Variance. The Anova option is used for investigating how well a category column categorizes a value column. For each combination of category column and value column, the tool calculates a p-value, representing the degree to which the category column predicts values in the value column. A low p-value indicates a probable strong connection between two columns.
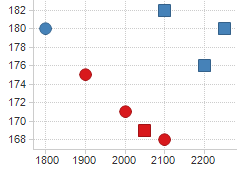
Consider the following scatter plot representing data about eight subjects: gender (male/female), owns car (yes/no), income ($), and height (cm). Income is plotted on the horizontal axis, and height on the vertical.

Blue markers represent car owners, red markers represent non-car owners. Squares represent male subjects, circles female subjects. If we perform an Anova calculation with gender and car as category columns, and income and height as value columns, the result will be four p-values as follows.
|
Value column |
Category column |
p-value |
|
Height |
Car |
0.00464 |
|
Income |
Gender |
0.047 |
|
Height |
Gender |
0.433 |
|
Income |
Car |
0.519 |
A low p-value indicates a higher probability that there is a connection between category and value column. In this case, Height and Car seem closely related, while Income and Car are not. We can verify this by examining the scatter plot.
See Requirements on input data for data relationships for more information about what data to use with this tool.
(For a mathematical description of the Kruskal-Wallis test, see Data Relationships Kruskal-Wallis algorithm.)
The Kruskal-Wallis option is used to compare independent groups of sampled data. It is the nonparametric version of one-way Anova and is a generalization of the Wilcoxon test for two independent samples. The test uses the ranks of the data rather than their actual values to calculate the test statistic. This test can be used as an alternative to the Anova, when the assumption of normality or equality of variance is not met.
(For a mathematical description of the chi-square calculation, see Data Relationships Chi-square independence test algorithm.)
The chi-square option is used to compare observed data with the data that would be expected according to a specific hypothesis (for example, the null-hypothesis which states that there is no significant difference between the expected and the observed result). The chi-square is the sum of the squared difference between observed and expected data, divided by the expected data in all possible categories. A high chi-square statistic indicates that there is a large difference between the observed counts and the expected counts.
From the chi-square statistic it is possible to calculate a p-value. This value is low if the chi-square statistic is high. Generally, a probability of 0.05 or less is considered to be a significant difference.