Univariate Plot Chart
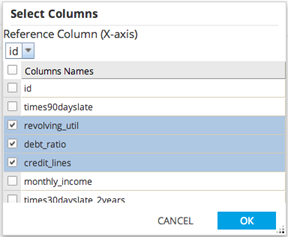
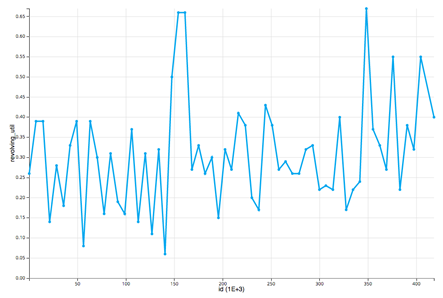
The Univariate Plot Chart allows users to choose a reference column (x-axis) and one or more Y columns from a dataset.
All of the columns must be of numerical type. A univariate chart is created for each Y column selected.
Related concepts
Copyright © Cloud Software Group, Inc. All rights reserved.