Time Series Chart
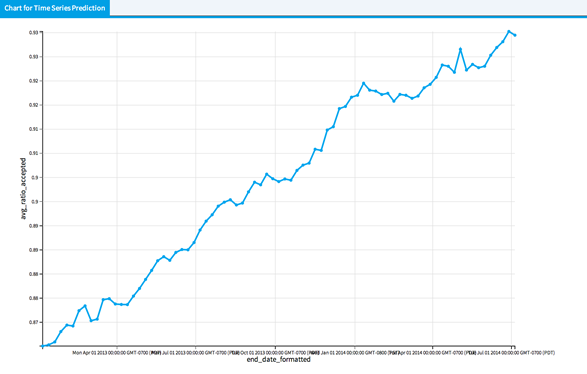
Use the Time Series Chart to visualize time series data.
- In order for Time Series Chart to be enabled, database operators must output a table/view.
- Time Series Chart is accessible from the
Explore menu of the operator toolbar or by right-clicking an appropriate operator.
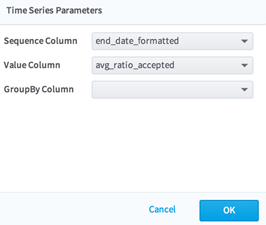
- Sequence Column corresponds to the X-axis.
- Value Column corresponds to the Y-axis.
Copyright © Cloud Software Group, Inc. All rights reserved.