Visualizes the attributes of a data set in bar chart format.
Information at a Glance
Category
Explore
Data source type
DB, HD
Sends output to other operators
No
Data processing tool
Pig
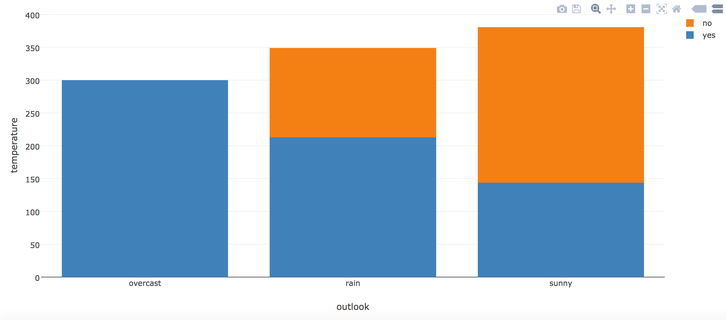
Use this operator to choose the following three attributes (columns) in the data table as the dimensions in the bar chart:
The X dimension (Category) takes a category-type attribute to construct the X-axis.
The Y dimension (Value) takes a numerical attribute to construct the Y-axis.
The grouped dimension (Series) accepts a category-type attribute to group the bars in the chart.
Input
A data set from the preceding operator.
Configuration
Parameter
Description
Notes
Any notes or helpful information about this operator's parameter settings. When you enter content in the
Notes field, a yellow asterisk is displayed on the operator.
Category
The categorical column for the X-axis.
Series
The categorical column for the groups.
Value
The numerical column for the Y-axis.
Output
Visual Output
A bar chart such as the following example.
Data Output
None. This is a terminal operator.
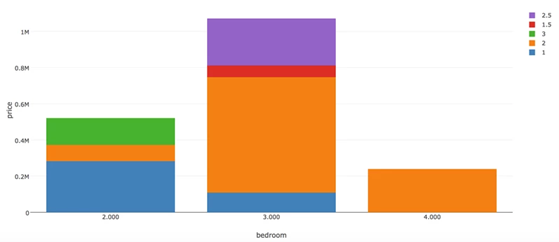
Example
The following example shows housing sale prices (Value) by number of bedrooms (Category) for each number of baths (Series).