Histogram
Analyzes the values of the selected fields of a data set, and generates a graphical representation of the frequency distribution of the numeric data.

Algorithm
Histogram analysis calculates data frequency for a specific column.
For each column specified, users input either the number of bins to generate or the width of the bins. A bin is an interval that is divided equally between minimum and maximum value or by the width.
For example, a specific column's minimum value is 0 and maximum value is 100. If the user specifies five bins, each bin covers 20 units. If 10 bins are specified, each bin covers 10 units.
Bounds of each bin are defined as (Minimum, Maximum].
Configuration
Output
- Visual Output
-
Four sections are displayed: Counts, Cumulative Counts, Percentage, and Data.
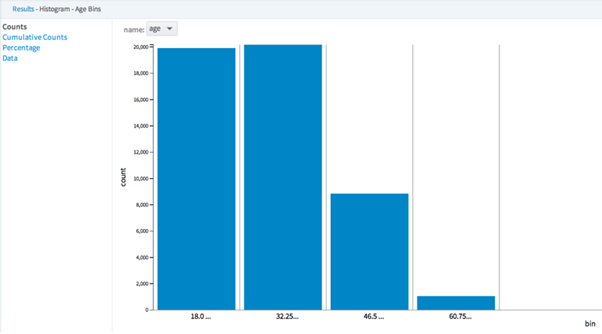
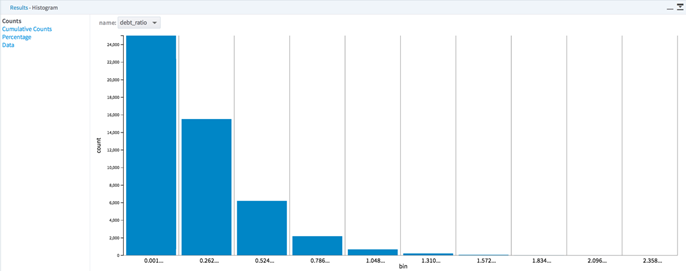
- Counts
- Displays the histogram for one column at a time according to the defined groups (bins). Users can select a column from the
name drop-down list.
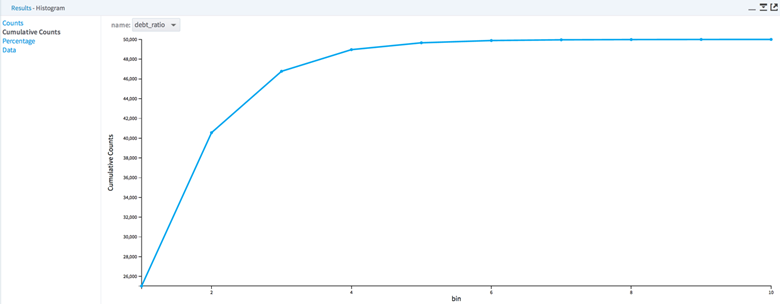
- Cumulative Counts
- Displays a graph of the number of rows included with each additional bin.
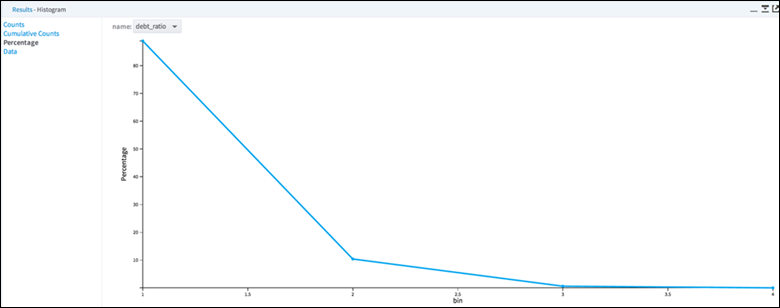
- Percentage
- Displays a graph showing what percentage of the input column each bin represents.
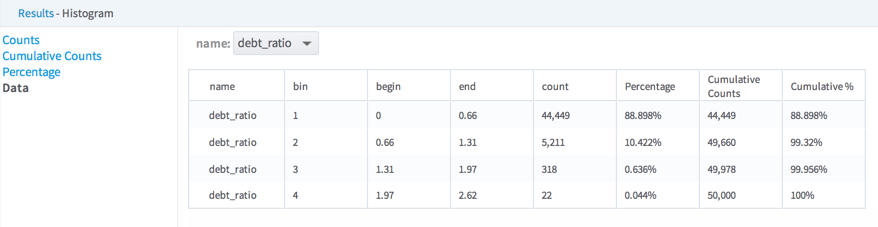
- Data
-
Summarizes information about each histogram, with numerical measures for:
Note: To learn more about the visualization available in this operator, see Exploring Visual Results. - Data Output
- None. This is a terminal operator.