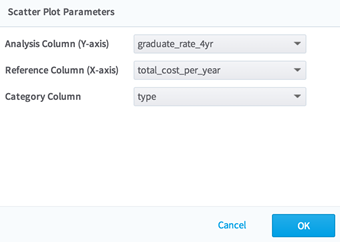
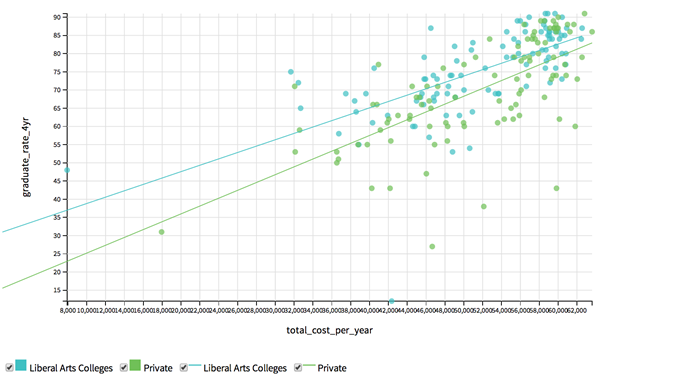
Scatter Plot Chart
Use Scatter Plot Chart to create a scatter plot of the corresponding dataset.
In order for Scatter Plot Chart to be enabled, database operators must output a table/view.
Scatter Plot Chart is accessible from the Explore menu of the operator toolbar or by right-clicking an appropriate operator.
Related concepts
Copyright © Cloud Software Group, Inc. All rights reserved.