Preview and Visualize Data
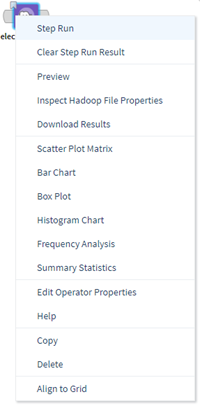
We provide several data visualization and exploration options in the contextual menu of any data source. Right-click the data operator to see the options.
In addition to on-the-fly data visualization, Team Studio provides additional data exploration and visualization functionality through the Exploration operators.
- Preview
Preview provides a way for you to quickly see a subset of the data contained in a dataset. - Show Table Metadata or Inspect Hadoop File Properties
The Show Table Metadata and Inspect Hadoop File Properties commands provide information about a data source. - Scatter Plot Chart
Use Scatter Plot Chart to create a scatter plot of the corresponding dataset. - Bar Chart
Visualizes the attributes of a data set in bar chart format. - Univariate Plot Chart
The Univariate Plot Chart allows users to choose a reference column (x-axis) and one or more Y columns from a dataset. - Box and Whisker Chart
The Box-And-Whisker Chart allows users to choose an analysis value column, an analysis series column, and an analysis type column from a dataset. - Histogram
Analyzes the values of the selected fields of a data set, and generates a graphical representation of the frequency distribution of the numeric data. - Summary Statistics (right-click)
If an operator is associated with a data set, then you can right-click the operator and click Summary Statistics to select columns, and then display statistics about the selection. - Time Series Chart
Use the Time Series Chart to visualize time series data. - Correlation Analysis
Correlation Analysis allows users to specify two or more numeric type attributes (columns) in a dataset for analysis. - Frequency Analysis
Use Frequency Analysis to view frequency statistics of one or more selected columns.
Related concepts
Related tasks
Related reference
Copyright © Cloud Software Group, Inc. All rights reserved.

