
Performance Tab
This tab helps us understand how the models in a scoring pipeline are performing.
Contents
Overview
The TIBCO ModelOps environment captures two types of real-time metrics, technical and model quality, during the execution of all services. These metrics are reported by the TIBCO ModelOps components as they execute. They are collected by a Metrics Store provided by Prometheus, which is installed in the TIBCO ModelOps cloud infrastructure. LiveView monitors the Metrics Store in real-time and aggregates the raw metric values to provide support for a rich visualization of a subset of the metrics on the ModelOps UI. Different types of metrics and models used for calculating the performance are summarized in the architecture guide.
Understanding the Metrics
Before selecting the metrics, make sure you enter proper environment and pipeline for deployment. Click Apply after you have entered the details. You can select 4 metric cards at a time to see the performance. Each card is represented using a line graph. At the bottom of each card, you can find a menu icon.
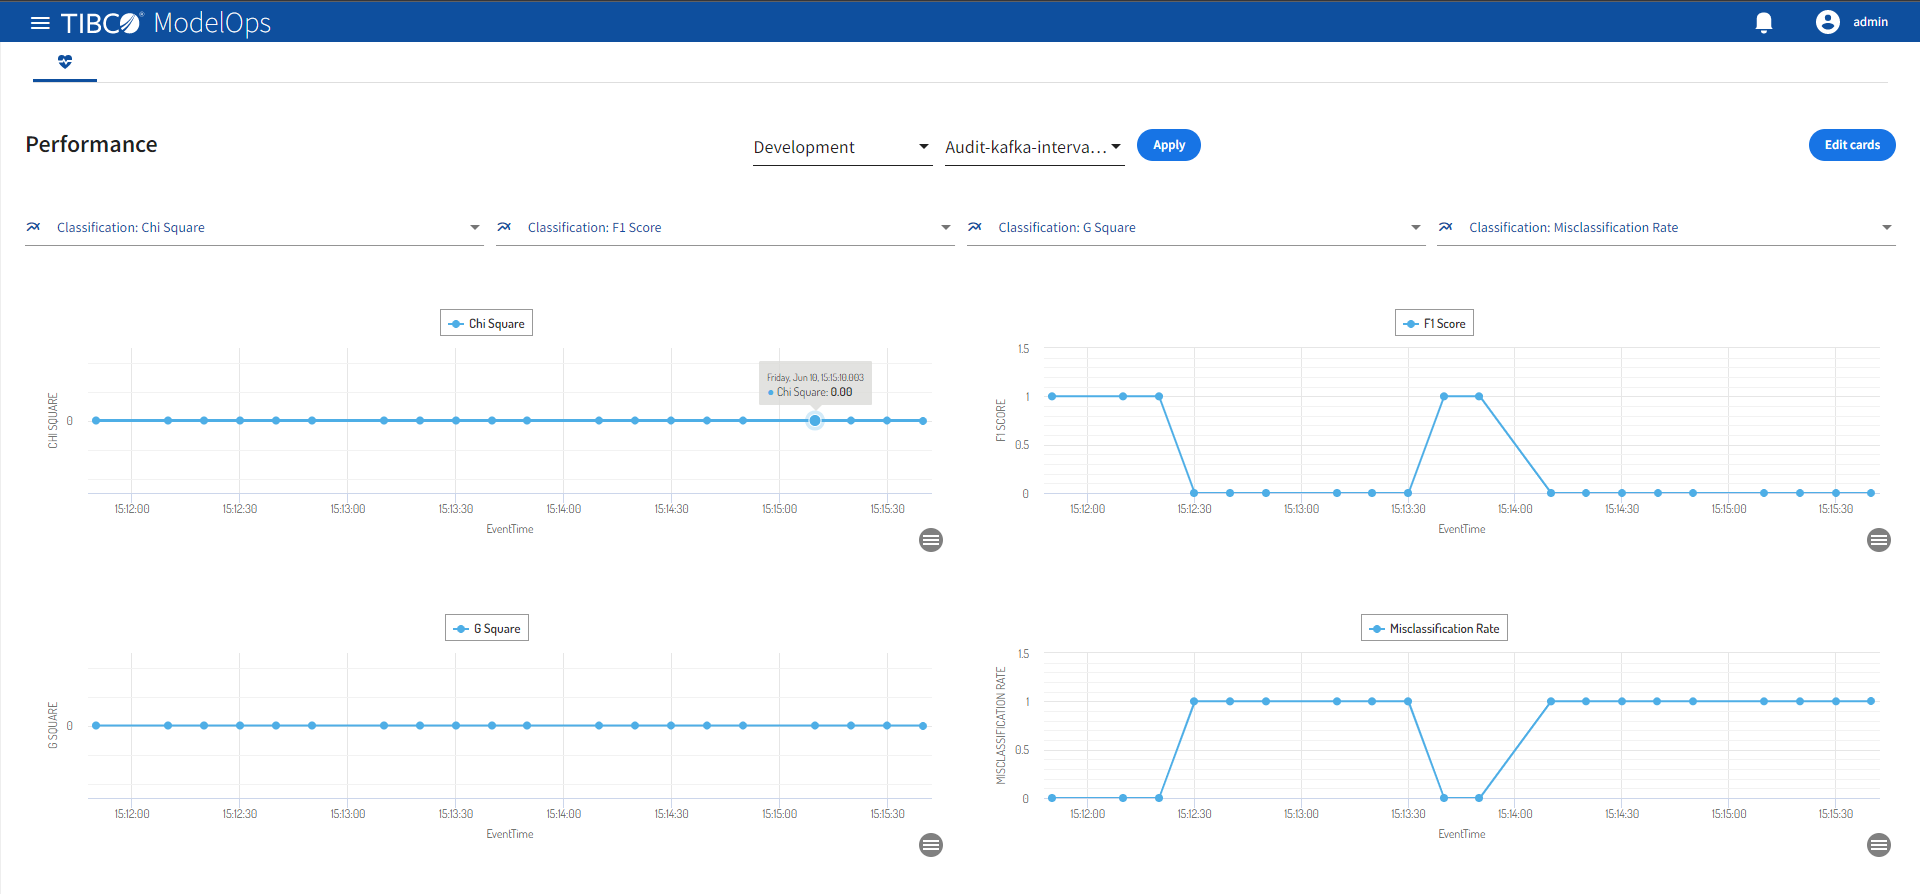
Clicking the menu icon offers the following options:
- Ability to pause and resume the metric card
- Refresh the metric card