Hawkular Monitoring Support
The TIBCO OPE provides support for exposing the application bean JMX endpoints on the HTTP protocol, by using Jolokia library.
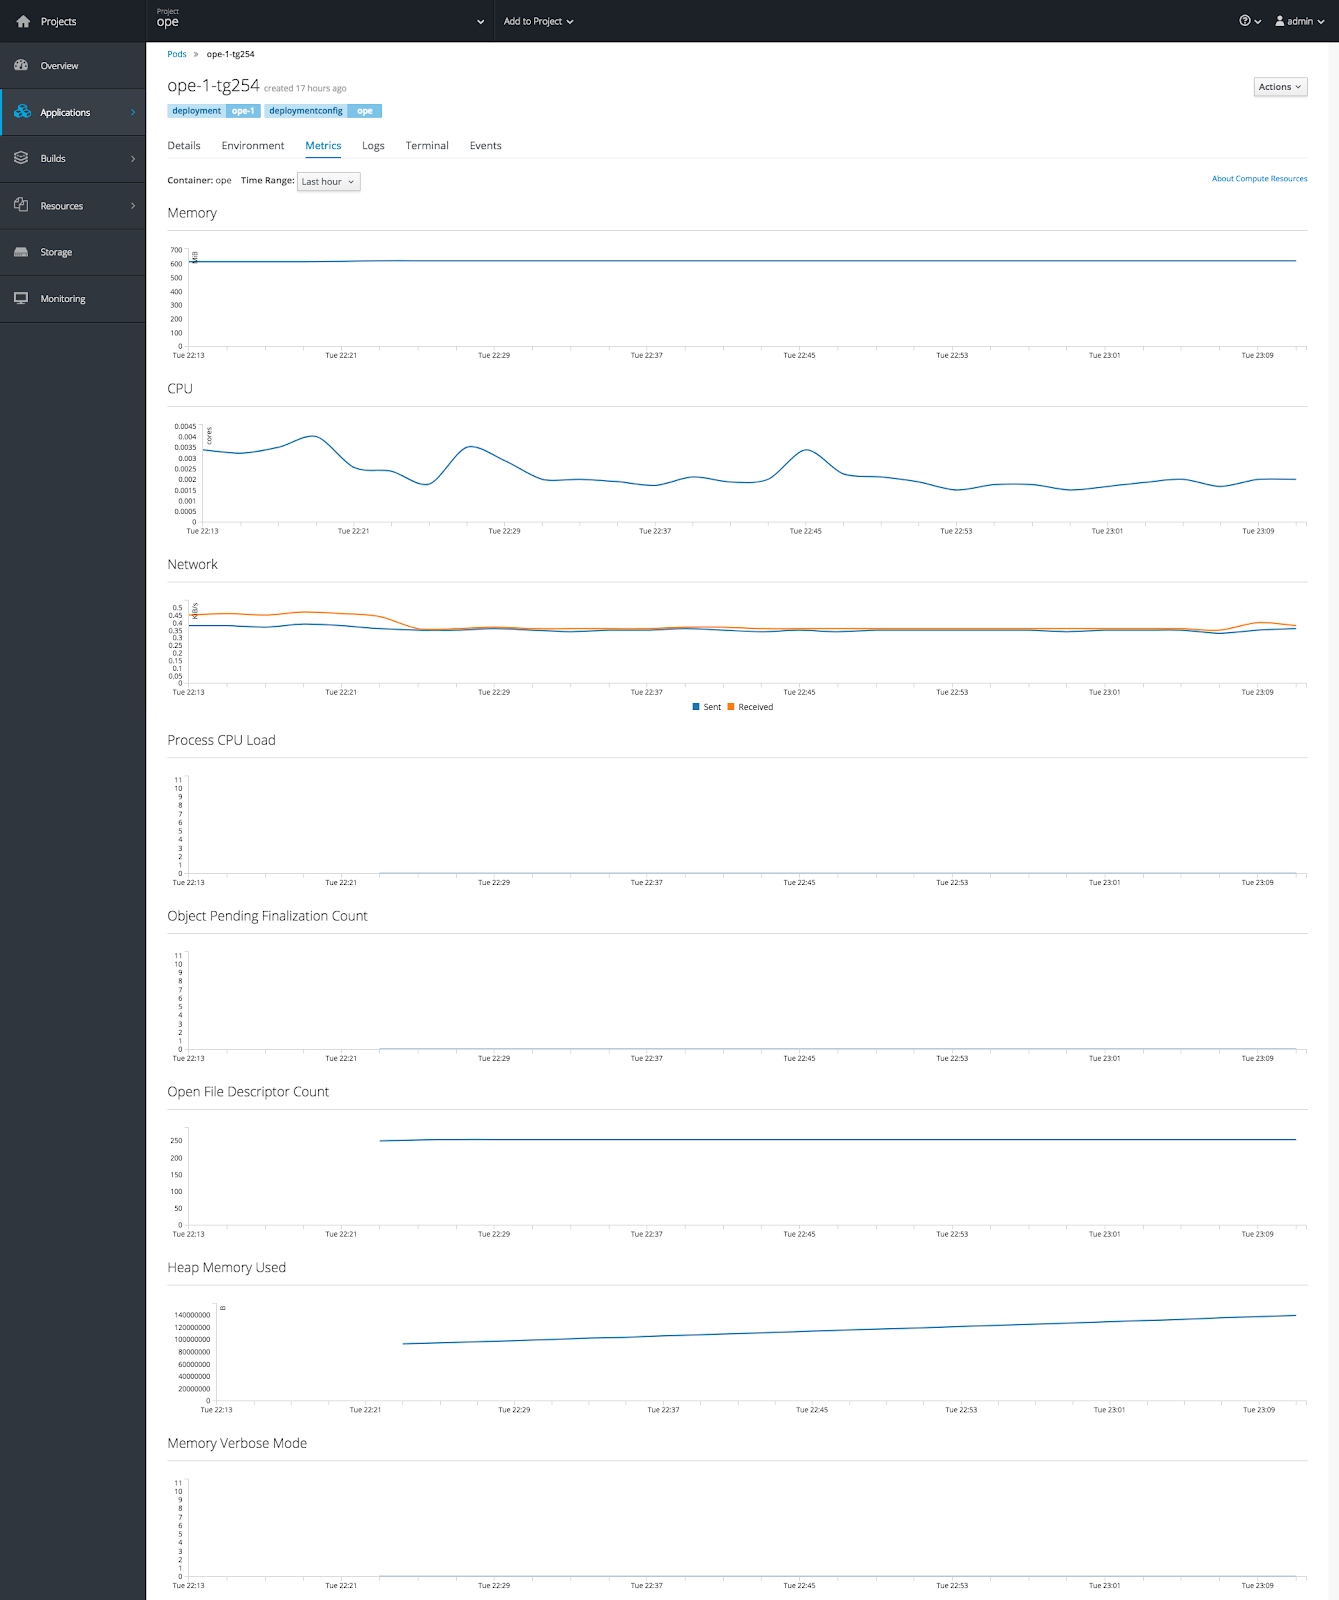
Jolokia is a third-party library released under Apache license and enables exposing application JMX information on HTTP protocol. An OpenShift monitoring application such as Hawkular uses this information to display the additional metrics as shown below.

An example of an Offer and Price Engine deployment YAML file with Jolokia configuration:
ope_openshift.yaml
================================
apiVersion: v1
kind: List
items:
- apiVersion: v1
  kind: Service
  metadata:
    name: ope
  spec:
    ports:
    - port: 9090
      targetPort: 9090
      name: jolokia
    selector:
      deploymentconfig: ope
- apiVersion: v1
  kind: DeploymentConfig
  metadata:
    name: ope
    annotations:
      hawkular-openshift-agent: ope-jolokia
  spec:
    replicas: 1
    selector:
      deploymentconfig: ope
    strategy:
      # We set the type of strategy to Recreate, which means that it will be scaled down prior to being scaled up
      type: Recreate
    template:
      metadata:
        labels:
          deploymentconfig: ope
      spec:
        containers:
        - image: tibco/ope:5.0
          name: ope
          ports:
          - name: jolokia
            containerPort: 9090
          - name: http
            containerPort: 9090
          env:
          - name: CONSOLE_LEVEL
            value: INFO
          - name: CONSUL_HOST
            value: 10.97.97.34
          - name: CONSUL_PORT
            value: '8500'
          volumes:
            - name: hawkular-openshift-agent
              configMap:
                name: ope-jolokia
          readinessProbe:
              failureThreshold: 3
              httpGet:
                path: /actuator/ready
                port: 9090
                scheme: HTTP
              periodSeconds: 300
              successThreshold: 1
              timeoutSeconds: 3
          livenessProbe:
              failureThreshold: 3
              httpGet:
                path: /actuator/health
                port: 9090
                scheme: HTTP
              periodSeconds: 300
              successThreshold: 1
              timeoutSeconds: 3
          resources:
            limits:
              cpu: '2'
              memory: 2Gi
            requests:
              cpu: '1'
              memory: 1Gi
- apiVersion: v1
  kind: ConfigMap
  metadata:
    name: ope-jolokia
    labels:
      name: ope-jolokia
  data:
    hawkular-openshift-agent: |
      endpoints:
      - type: jolokia
        protocol: http
        port: 9090
        path: /actuator/jolokia/
        collection_interval: 15s
        metrics:
        # int data value
        - name: java.lang:type=Memory#ObjectPendingFinalizationCount
          type: gauge
          description: Object Pending Finalization Count
        # long data value
        - name: java.lang:type=OperatingSystem#OpenFileDescriptorCount
          type: gauge
          description: Open File Descriptor Count
        # double data value
        - name: java.lang:type=OperatingSystem#ProcessCpuLoad
          type: gauge
          description: Process CPU Load
        # composite data value
        - name: java.lang:type=Memory#HeapMemoryUsage#used
          type: gauge
          description: Heap Memory Used
          units: B
        # boolean value
        - name: java.lang:type=Memory#Verbose
          type: gauge
          description: Memory Verbose Mode
- apiVersion: v1
  kind: Route
  metadata:
    name: ope
  spec:
    to:
      kind: Service
      name: ope
- apiVersion: autoscaling/v1
  kind: HorizontalPodAutoscaler
  metadata:
    name: ope
  spec:
    scaleTargetRef:
      kind: DeploymentConfig
      name: ope
      apiVersion: v1
      subresource: scale
    minReplicas: 1
    maxReplicas: 3
    targetCPUUtilizationPercentage: 5
Copyright © Cloud Software Group, Inc. All rights reserved.
