Space Put and Take Operations
Space Put and Take Operations takes into account all the updates for all spaces that are performed by all members connected to the metaspace.
You can see a graphical representation of the Put and Take operations performed on all spaces over a point in time. For example, to see the Put and Take Operations performed in the last 10 minutes, click .
The graph shows the operations that have taken place in the last ten minutes. Similarly you can see data for the past one hour, four days, or the last day.
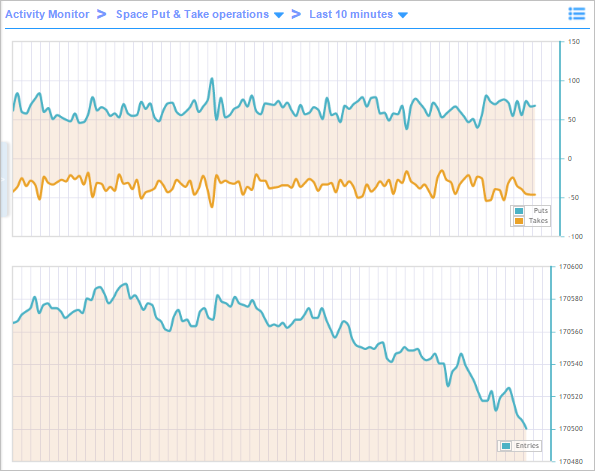
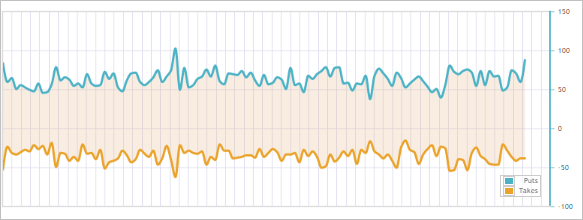
The top graph shows 2 data series representing the Put and Take operations over time. Put counts are presented as positive values and the Take counts are presented as negative values.
Copyright © Cloud Software Group, Inc. All rights reserved.