Using OVER statements in calculated columns
You can perform calculations on your data, and display the results as values in a new column that is added to the data table. In the expression used for the calculation, you can use an OVER statement. However, using the OVER statement in calculated columns works differently from using it in custom expressions. In calculated columns, the OVER expression is used to calculate separate, fixed, values for different groups and the OVER expression might cause the data to be 'sliced into fewer records'.
When you work with calculated columns, there are no axes available to navigate over, as in the case with custom expressions. Instead, you use the OVER expression to refer to a data column (or hierarchy).
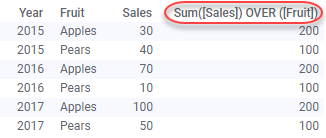
In the data table below, the expression
Sum([Sales]) OVER ([Fruit])
is used for calculations of the values in the added column:
Extended example
The calculated column with fewer records may not be very useful as a standalone column. However, let us add another column, where the previous expression is a part of the expression used:
[Sales] / (Sum([Sales]) OVER ([Fruit]))
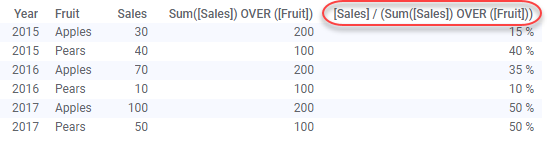
This expression calculates each sales transaction's relative contribution to the total sales over the years within its fruit type. For example, 15% (30/200) of the total apples sales was in 2015, 35% (70/200) in 2016, and the rest, 50% (100/200), in 2017.
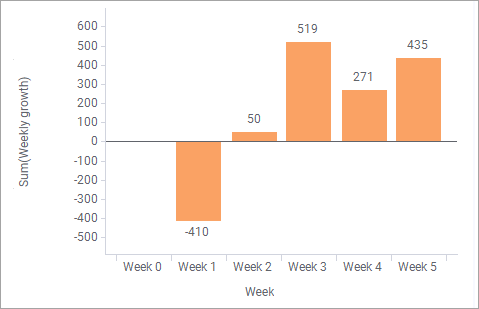
In the bar chart below, the calculated column is selected on the Value axis using the Sum aggregation.
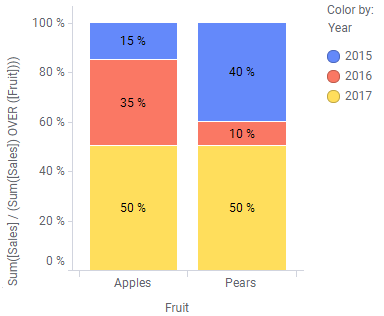
In fact, this result is the same as using the 100% stacked bars option in a bar chart showing Sum([Sales]).
Combining OVER with a node navigation method in a calculated column
In the expression used for calculating a column, you can use the OVER statement in combination with a node navigation method. This simple example gives you an idea how to use one of the methods, Previous().
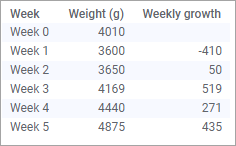
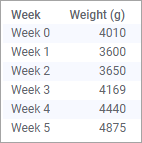
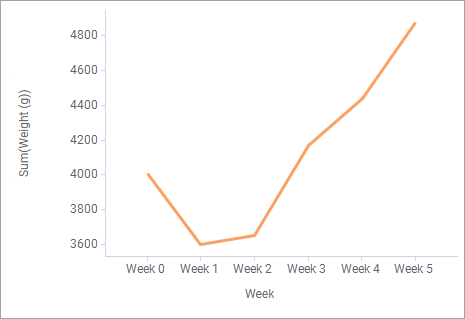
The data table lists weekly measured weights for a newborn child, visualized in a line chart.
Assume you are interested in the weekly growth. This can be calculated using the expression:
[Weight (g)] - Sum([Weight (g)]) OVER (Previous([Week]))
The results can be viewed in the data table and bar chart below.